
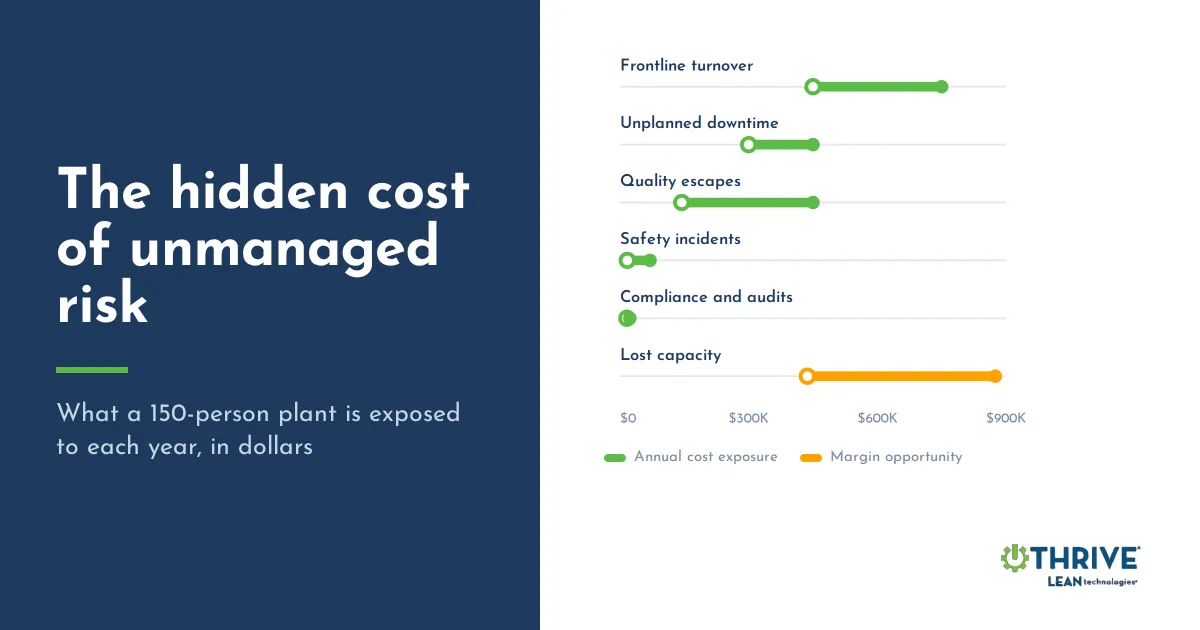
The Hidden Cost of Unmanaged Risk in Manufacturing: What a 150-Person Plant Is Exposed To
Many manufacturers don't price operational risk until something breaks. A press goes down on second shift. A customer rejects a shipment. An OSHA inspector shows up after a recordable injury. Only then does the cost become real.
The problem is that by then, the exposure has existed for months. It just never appeared on a P&L line. Downtime hides inside missed shipments. Turnover hides inside overtime and scrap. Audit prep hides inside the salaried hours of people who are supposed to be improving the plant.
This article puts a dollar figure on six common operational risks for a typical mid-size plant. Every number uses conservative, public benchmarks, and every assumption is shown so the math can be checked or challenged.
The example plant
To keep the math concrete, every section uses the same hypothetical facility:
150 employees
About $25 million in annual revenue
Two production shifts, roughly 4,000 production hours per year
A mix of preventive and reactive maintenance, with some spreadsheets and some paper
That profile describes thousands of plants across the country. It isn't a worst case. It's a normal plant doing reasonably well.
The figures below are illustrative estimates, not predictions. Every plant is different. To run the numbers for a specific facility, the free Manufacturing Risk Exposure Estimator walks through the same six categories with adjustable inputs.
1. Safety incidents: roughly $17,000 to $70,000 a year
Safety is usually the first risk leaders think about, and it's often the smallest line in the model. That's not because injuries are cheap. It's because the direct fine is only a fraction of what an incident costs.
What a citation costs in 2026. OSHA did not raise its penalties this year. A federal funding lapse in October 2025 kept the Bureau of Labor Statistics from publishing the inflation data OSHA uses, so the 2025 amounts carried forward (OSHA, May 2026). The current maximums are $16,550 per serious violation and $165,514 per willful or repeat violation. Failure to abate can add $16,550 per day past the deadline.
The math for the example plant. The model uses a recordable injury rate of 3.5 per 100 full-time employees per year, a conservative manufacturing benchmark. At 150 employees, that's about 5 recordable incidents a year.
Citation exposure: if 15% to 35% of recordables lead to a citation at $5,000 to $16,550 each, the plant faces roughly $4,000 to $30,000 a year.
Indirect cost: about 30% of recordables involve lost time. At $8,000 to $25,000 in lifetime workers' comp cost each, that's roughly $13,000 to $39,000.
Total: about $17,000 to $70,000 a year.
What the model leaves out. A single serious injury can cost far more than this range. So can a repeat citation, which jumps to ten times the serious maximum. The model also ignores overtime to cover the injured worker, investigation time, and the hit to morale on the floor.
Where the gap usually is. Most plants track injuries. Fewer track near misses, and fewer still close corrective actions on a clear timeline. Hazards that were reported but never resolved are exactly what inspectors find. A digital system for near-miss reporting, root cause, and corrective action closeout turns a list of known hazards into a list of fixed ones.
Estimate your plant's safety exposure →
2. Unplanned downtime: roughly $300,000 to $450,000 in recoverable value
Unplanned downtime is where the numbers get large quickly. Every hour a constrained machine sits idle, the plant loses output it was counting on to hit shipments.
The math for the example plant. A $25 million plant running about 4,000 production hours a year produces roughly $6,250 of output value per hour. Twenty hours of unplanned downtime a month is a modest figure for a plant with mixed reactive and preventive maintenance. That's 240 hours a year, or about $1.5 million in production value at risk.
Not all of that is recoverable. The model counts only the share structured maintenance typically addresses: 20% to 30%. That puts the recoverable value at roughly $300,000 to $450,000 a year. One Thrive customer documented a 30% reduction in unplanned downtime across a multi-facility deployment. That's one data point, not a guarantee.
Why production value, not profit. Some lost output gets made up later. But recovery isn't free. It usually means weekend overtime, expedited freight, pushed-out orders, and a maintenance team that never gets ahead. Those costs rarely get tagged to the original breakdown, which is why downtime is chronically underestimated.
Where the gap usually is. Most unplanned downtime traces back to a handful of assets and a handful of repeat failure modes. Plants that fix it tend to do three things:
Schedule preventive maintenance by runtime or calendar, not memory.
Log every stop with a reason code, so patterns become visible.
Move work orders off paper so nothing past due goes unnoticed.
Estimate your plant's downtime exposure →
3. Quality escapes: roughly $144,000 to $450,000 a year
A defect caught at the station costs a few minutes. The same defect caught on a customer's receiving dock costs rework, scrap, freight both ways, a credit, and a little bit of trust.
The math for the example plant. Assume the plant ships about 5,000 units a month, or 60,000 a year. Even at a low customer-reported defect rate of 0.3%, that's 180 escapes a year. At $800 to $2,500 per escape, which covers rework labor, scrap, expedited freight, and a partial credit, the exposure is roughly $144,000 to $450,000.
The sensitivity matters here. At an average defect rate of 1.2%, the same plant sees about 720 escapes and $576,000 to $1.8 million in exposure. Complex assemblies and regulated industries like aerospace and medical run far higher per escape.
What the model leaves out. Customer scorecards, corrective action requests, and the risk of losing a program entirely. For suppliers with one or two dominant customers, that last one can dwarf everything else on this page.
Where the gap usually is. Not every escape is preventable. Some start with raw material or design. But many start with process gaps that were seen before and never closed. Logging defects at the source, tracking non-conformances to closure, and running root cause on repeat issues keeps the same problem from shipping twice.
Estimate your plant's quality exposure →
4. Frontline turnover: roughly $450,000 to $750,000 a year
Turnover is the risk plant leaders feel most and measure least. It rarely shows up as one number. It shows up as open reqs, overtime, new hires running the line slower, and supervisors spending their week training instead of improving.
The math for the example plant. Industry benchmarks put manufacturing turnover near 28% a year. To stay conservative, this example uses 20%. At 150 employees, that's 30 people replaced every year. At $15,000 to $25,000 per replacement, which covers recruiting, onboarding, lost productivity during ramp-up, and supervisor time, the cost is roughly $450,000 to $750,000.
The hidden multiplier. Turnover feeds the other risks on this list. New operators have more safety incidents, make more quality mistakes, and are slower to spot a machine that's about to fail. The cost in this section is only the direct replacement cost.
Where the gap usually is. Industry research suggests that unclear priorities, poor tools, and a lack of recognition contribute to voluntary turnover. No software fixes pay or culture on its own. But frontline workers who have clear task ownership, mobile tools that work, and visible recognition for good work have fewer daily reasons to leave.
Estimate your plant's turnover exposure →
5. Compliance and audits: roughly $16,000 to $23,000 a year
The direct cost of audit risk looks small. The real cost is who pays it: the quality manager, the EHS lead, and the plant manager, pulled off improvement work to chase binders before every visit.
The math for the example plant. Assume six audits a year across internal, customer, and regulatory, with about 40 hours of prep each. At a loaded rate of $55 an hour, that's roughly $13,200 in prep labor. For a plant with partial digital records, the model assumes about a 15% chance that each external audit surfaces a citation-level finding. Across four external audits, at $5,000 to $16,550 per finding, that adds roughly $3,000 to $10,000. The total is about $16,000 to $23,000.
The paper-based version. A plant still running on binders and clipboards often doubles its prep time and triples its odds of a finding. The same six audits then cost closer to $32,000 to $46,000.
What the model leaves out. A failed customer audit can mean probation, lost preferred-supplier status, or a lost certification. Those outcomes don't have a standard dollar figure, but they're the reason audit readiness matters.
Where the gap usually is. Audit prep is a scramble when records live in five places. Structured digital audit templates, controlled SOPs, and an automatic audit trail make readiness a standing condition rather than a quarterly project.
Estimate your plant's compliance exposure →
6. Lost capacity: roughly $440,000 to $875,000 a year, if demand is there
The first five risks are about cost. This one is about revenue. It only applies to one kind of plant: one that could sell more if it could make more.
The math for the example plant. The average discrete manufacturer runs at about 65% OEE. World-class plants run near 85%. Plants that move from reactive to structured operations commonly gain 5% to 10% in OEE. For a $25 million plant with a 35% contribution margin, that gain is worth:
$25,000,000 × 5% to 10% × 35% = $437,500 to $875,000
That's margin, not revenue, because every recovered hour produces product that sells at the plant's normal contribution margin.
The important caveat. If the plant isn't capacity-constrained, this number is zero. Extra capacity with no orders to fill it doesn't generate anything. This category also overlaps with downtime. Recovered downtime hours are one of the main ways OEE improves, so the two figures shouldn't simply be added together.
Where the gap usually is. Most plants know their OEE is lower than it should be. Fewer know exactly where the losses are. Real-time OEE visibility, reason-coded downtime, and standard work compliance show which shifts, lines, and machines are leaving capacity on the table.
Estimate your plant's capacity opportunity →
Adding it up: roughly $0.9 million to $1.7 million a year
For the example plant, the five cost-side risks add up to about $927,000 to $1.74 million a year. That's roughly 4% to 7% of revenue, before counting any capacity opportunity.
Risk area | Estimated annual exposure |
Frontline turnover | $450,000 to $750,000 |
Unplanned downtime (recoverable share) | $300,000 to $450,000 |
Quality escapes | $144,000 to $450,000 |
Safety incidents | $17,000 to $70,000 |
Compliance and audits | $16,000 to $23,000 |
Total, cost-side risks | $927,000 to $1,743,000 |
Lost capacity (only if demand exceeds capacity) | $437,500 to $875,000 |
Two patterns stand out. First, the risks leaders talk about most, safety fines and audits, are the smallest dollar lines. Turnover and downtime are the largest. Second, none of these costs appear on a single line of the P&L. They're spread across overtime, freight, scrap, credits, and salaried hours, which is why they persist.
Where to start
No plant fixes six risks at once. A practical sequence:
Price the exposure. Put rough numbers on each category using the plant's own data where it exists.
Pick the biggest line. For most mid-size plants, that's downtime or turnover.
Fix visibility first. Most of these risks persist because the information lives on paper, in spreadsheets, or in someone's head.
Build on one platform. Maintenance, quality, safety, and frontline engagement share the same people and data. Tools that connect them avoid creating a new set of silos.
Run the numbers for your plant
The Manufacturing Risk Exposure Estimator walks through all six categories in a few minutes. Defaults are conservative, every assumption is visible, and any category that doesn't apply can be skipped. The result is a dollar range for each risk area, plus a view of where structured digital tools typically help.
Frequently asked questions
How much does unplanned downtime cost a manufacturer?
It depends on output value per hour. A $25 million plant running two shifts produces about $6,250 per hour, so 20 hours of unplanned downtime a month puts roughly $1.5 million in production value at risk each year.
What is the OSHA penalty for a serious violation in 2026?
Up to $16,550 per violation. Willful and repeat violations run up to $165,514. OSHA did not raise penalties for 2026 because the inflation data it relies on wasn't published.
What does it cost to replace a frontline manufacturing employee?
Industry benchmarks put it at $15,000 to $25,000, including recruiting, onboarding, ramp-up productivity loss, and supervisor time.
What is a good OEE for a manufacturing plant?
The average discrete manufacturer runs around 65%. World-class operations reach about 85%.
Is a risk estimate the same as a savings guarantee?
No. These figures estimate exposure, not results. Actual outcomes depend on the plant's processes, industry, customers, and current maturity.
Sources
OSHA, 2026 Annual Adjustments to OSHA Civil Penalties (May 21, 2026)
Thrive Manufacturing Risk Exposure Estimator: benchmarks and assumptions (BLS injury and turnover data, Deloitte/SHRM replacement cost research, industry OEE benchmarks)