
The Best Manufacturing Analytics Software for 2025
Real-World Pain: Why Most Manufacturing Analytics Tools Miss the Mark
A manufacturing analytics platform helps you turn messy shop floor data into clear, actionable insights—so you can track downtime, spot bottlenecks, and drive continuous improvement without drowning in spreadsheets or waiting days for reports. Manufacturing analytics provides the foundation for these insights.
Quick answer for evaluating manufacturing data software:
General-purpose BI tools are powerful but require heavy setup, data modeling, and technical support
Manufacturing-specific platforms, like Thrive, come pre-built by manufacturing experts for shop floor workflows like OEE tracking, maintenance analytics, and real-time issue logging
Look for: mobile-first design, fast rollout (days not months), integrations with your ERP/MES, and features your operators will actually use
Red flags: platforms that need extensive coding, take months to implement, or force you to replace systems that already work
Here's the truth most software vendors won't tell you: nearly 47% of manufacturers struggle to find the right analytics tool for their business.
Not because they can't afford it. Not because they don't want it.
Because most platforms are built for data scientists—not for the operations manager who needs to know right now why Line 3 keeps going down.
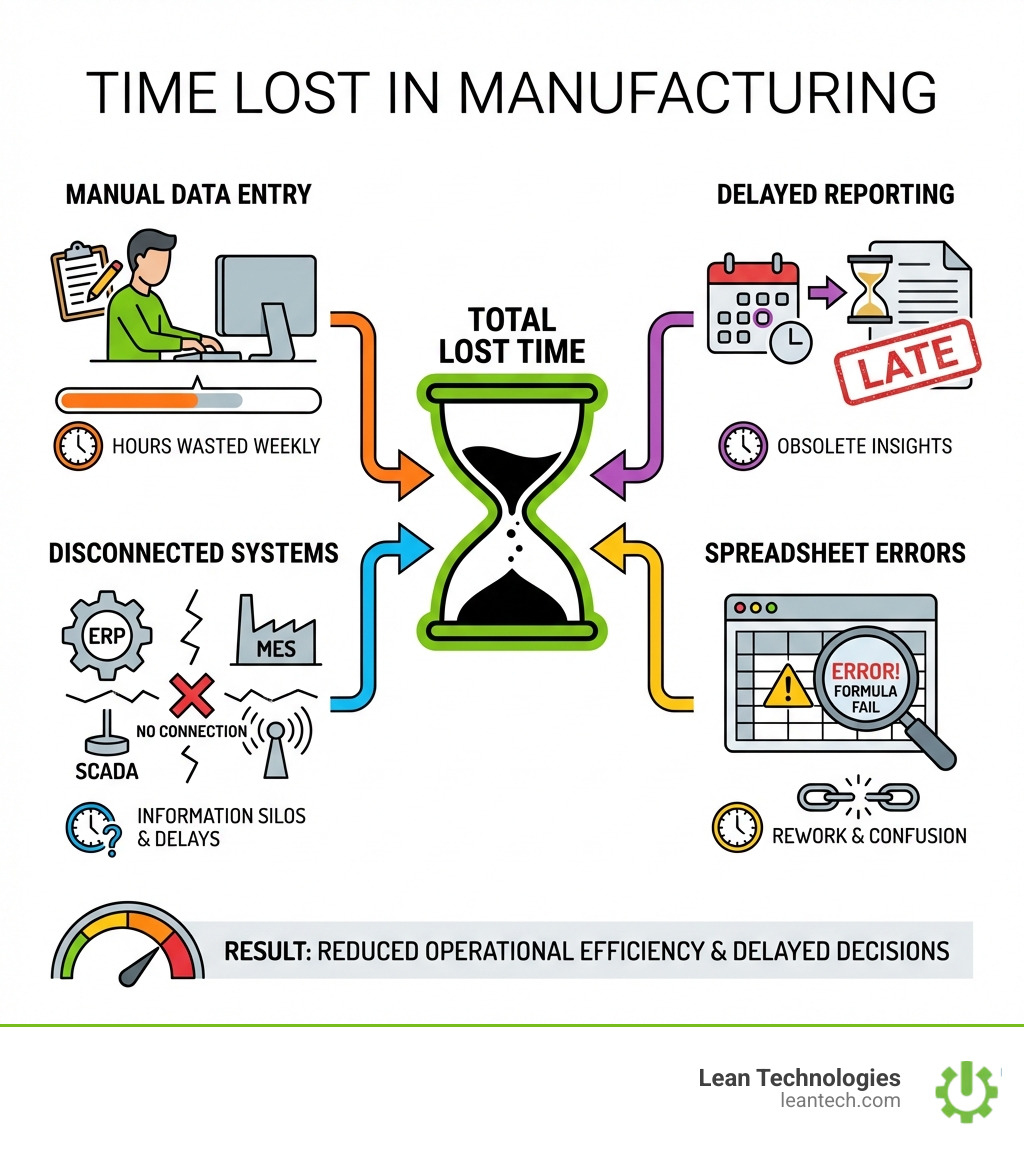
You're already buried in data. Your ERP tracks orders. Your MES logs production counts. Your SCADA system monitors machines. Your quality team uses spreadsheets. Your maintenance crew writes work orders on clipboards.
But none of it talks to each other.
So you spend hours every week pulling numbers from five different systems, manually building reports, and chasing down operators to fill in the blanks. By the time you've got a clear picture of what happened last shift, the next shift is already halfway done.
That's not analytics. That's archaeology.
Real manufacturing analytics should give you real-time visibility into what's happening on your shop floor—while it's happening. Not at the end of the shift. Not after someone enters data into Excel. Not when IT finally gets around to building that dashboard you requested six months ago.
The problem isn't that you don't have enough data. The problem is your data lives in silos, shows up late, and requires a decoder ring to understand.
Finance, planning, and operations teams end up relying on manual workarounds because the "analytics platform" their company bought three years ago still isn't set up right. Non-technical users get stuck waiting for IT to run reports. Critical decisions get delayed because nobody can agree on which number is correct.
Meanwhile, your competitors are finding hidden capacity, cutting downtime by 30%, and making smarter decisions faster—because they're using tools built for manufacturing, not just "business intelligence."
The good news? You don't need to replace your ERP or rip out your MES. You don't need a data science team. And you don't need to spend six months on implementation.
You need a platform that works the way your team actually works—mobile-first, easy to roll out, and focused on the metrics that matter on the shop floor. This is why we built Thrive: a cohesive, integrated platform developed by manufacturing experts to streamline operations, boost productivity, and improve profit.
This guide breaks down what to look for, what to avoid, and how to pick a manufacturing analytics platform that delivers results in days, not months.
Why Picking a Manufacturing Analytics Platform Feels Impossible
Ever feel like you’re trying to build a puzzle where the pieces come from five different boxes? That’s what selecting a manufacturing analytics platform feels like for most operations leaders.
The data is everywhere. Your ERP has the financial and order data, but it’s blind to what’s actually happening at the machine. Your MES might track production, but it doesn't tell you why a quality issue happened three hours ago. Because these systems don't talk, your team reverts to manual workarounds—clipboards, "tribal knowledge," and the dreaded Friday afternoon spreadsheet marathon.
This lack of connectivity leads to inconsistent numbers. The Plant Manager sees one OEE figure, while the Maintenance Lead sees another. When the data is "real-late" (entered days after the fact), you aren't managing production; you're just documenting history.
The 47% Selection Roadblock
As mentioned, nearly half of manufacturers get stuck in "analysis paralysis." The biggest hurdles are compatibility and the fear of technical debt. Many tools take weeks or months to implement, requiring specialized consultants just to get a single dashboard live. If a tool isn't compatible with your existing ecosystem or requires your operators to change how they work fundamentally, it will face massive user pushback.
Monitoring vs. True Analytics
There is a massive difference between looking at a speedometer and looking at engine diagnostics.
Monitoring tells you how fast you are going right now. (e.g., "The machine is red.")
Analytics tells you why your fuel efficiency drops at certain speeds over the last month. (e.g., "We lose 15% of capacity every Tuesday during shift change because of a specific setup procedure.")
True analytics move you from "What happened?" to "Why did it happen?" and "How do we stop it from happening again?"
5 Must-Have Capabilities in a Manufacturing Analytics Platform
If you're evaluating software for 2026, don't get distracted by flashy charts. Look for these five core capabilities that actually drive shop floor results.
Feature General BI Tools Shop Floor-Focused Platform Setup Effort High (Needs data modeling) Low (Pre-built workflows) Data Source Static databases/Excel Real-time shop floor inputs User Fit Data Analysts/Execs Operators/Supervisors/CI Leads Action Tracking No (Just visualization) Yes (Logs issues & tasks) Mobile Access Often limited/clunky Mobile-first for the floor
1. Fast, Searchable Insights for Everyone
Modern platforms are moving away from complex menus toward natural language queries. Think of it as a "Google for your factory." Non-technical users—like a shift supervisor—should be able to ask, "Which machine had the most unplanned downtime last week?" and get an instant answer without writing code or waiting for an IT ticket.
2. Location-Based and Safety Analytics
Understanding material flow is a game-changer. Some platforms use Real-Time Location Systems (RTLS) to track asset movement and identify bottlenecks. By analyzing "dwell time" (how long a part sits idle), you can pinpoint exactly where production stalls. Furthermore, tracking safety incidents and near-misses in the same platform where you track production ensures that safety remains a core part of your operational data, not an afterthought.
3. High-Frequency Data—When It Matters
For CNC-heavy environments or high-speed packaging, you need to capture what's happening at the "micro" level. Standardized data from machines helps identify cycle time variations that human observation misses. When combined with shift-by-shift checks, this reveals "hidden capacity"—the ability to double capacity without buying a single new machine.
4. Maintenance and Reliability Analytics
Stop fighting fires and start managing assets. A solid platform will automatically generate Pareto charts showing your "bad actors"—the 20% of machines causing 80% of your headaches. By tracking work order history and Mean Time Between Failure (MTBF) trends, you can move from reactive "fix it when it breaks" to proactive "service it before it fails."
5. Supply Chain and Inventory Visibility
Your shop floor doesn't exist in a vacuum. You need to see how supplier delays impact your production schedule. Integrated analytics help you track project management milestones and inventory levels in real-time. If a critical part is running low, the system should flag it before the line stops, not when the bin is empty.
Core Features to Look for in 2026
The best manufacturing analytics platform in 2026 won't be a desktop-only application. It will be a mobile-first tool that lives in the pockets of your operators.
No-Code Setup: You should be able to configure dashboards and logs yourself. If you need a consultant every time you want to track a new KPI, the tool is too complex.
OEE Tracking: This is the gold standard for productivity. It should be automated and easy to digest.
Real-Time Alerts: If a critical quality threshold is breached, the quality engineering team needs a notification immediately, not a report on Monday morning.
Role-Based Dashboards: An operator needs to see their current output; a Plant Manager needs to see the whole facility's performance. The platform should filter the noise automatically.
Connecting Analytics to Your Existing Systems
Your analytics tool shouldn't be another silo. Look for platforms that support:
ERP/MES Links: Bi-directional data flow so you aren't entering the same part number twice.
Unified Namespace (UNS): A modern architecture that allows all your devices and applications to share data seamlessly via protocols like MQTT. If this concept is new to you, the Unified Namespace Wikipedia article provides a helpful overview of how this architecture works.
Generative AI and Natural Language
Generative AI is finally becoming useful on the shop floor. Modern tools use AI to capture "tribal knowledge"-if an operator solves a recurring machine jam, the AI can suggest that same fix to a new hire three months later. It can also spot anomalies in data that a human might miss, like a slow creep in vibration levels that signals an impending bearing failure.
The Real Impact: Productivity, Capacity, and Utilization
What does this actually look like in practice? The numbers are staggering when you stop guessing and start measuring:
16.5% increase in productivity by simply identifying and removing small, recurring friction points.
2X increase in capacity without purchasing additional machinery, just by optimizing schedules and reducing idle time.
52% utilization increase through better visibility into shift changeovers and setup times.
By focusing on continuous improvement, teams can turn data into a "system of action." Instead of just seeing that you're behind, the platform tells you exactly which lever to pull to get back on track.
Get Results Fast—Not in Months
The era of the "two-year digital transformation" is over. You should see "time-to-value" in days. Start small—digitize one line or one process (like HR and training logs)—and scale once you've proven the ROI. Self-serve analytics mean your team owns the process, leading to much higher adoption rates than top-down corporate mandates.
Frequently Asked Questions about Manufacturing Analytics Platforms
What’s the difference between a general BI tool and a manufacturing-specific platform?
General-purpose BI tools are "empty boxes." You have to build the logic, the data models, and the charts from scratch. A manufacturing-specific platform comes with the "manufacturing brain" already installed—it knows what OEE is, how to handle shift patterns, and how to track downtime right out of the box.
How does AI help non-technical shop floor teams?
AI acts as a force multiplier. It can translate complex data into plain English, suggest root causes for downtime, and help capture the expertise of your veteran engineers so that knowledge isn't lost when they retire.
Can these platforms connect with my ERP and MES?
Yes. Most modern platforms use secure APIs or "Unified Namespace" structures to pull data from your ERP and your MES, giving you a single version of the truth without replacing your core systems.
What to Do Next
The most expensive thing on your shop floor isn't a new machine—it's the data you're currently ignoring. Every hour spent on manual data entry is an hour not spent improving your process.
Stop managing your shop floor through spreadsheets and wishful thinking.
If you want to see how real-time visibility can transform your operations, start by structuring your processes. Whether you are looking to boost OEE, reduce downtime, or finally get a handle on your maintenance backlog, the right platform makes the complex simple.
Stop managing through spreadsheets—run lean with our Guide to Digital Lean Manufacturing