
A Practical Guide to 6 Sigma Levels and Certification Paths
6 Sigma Levels: What the Numbers and Belts Mean
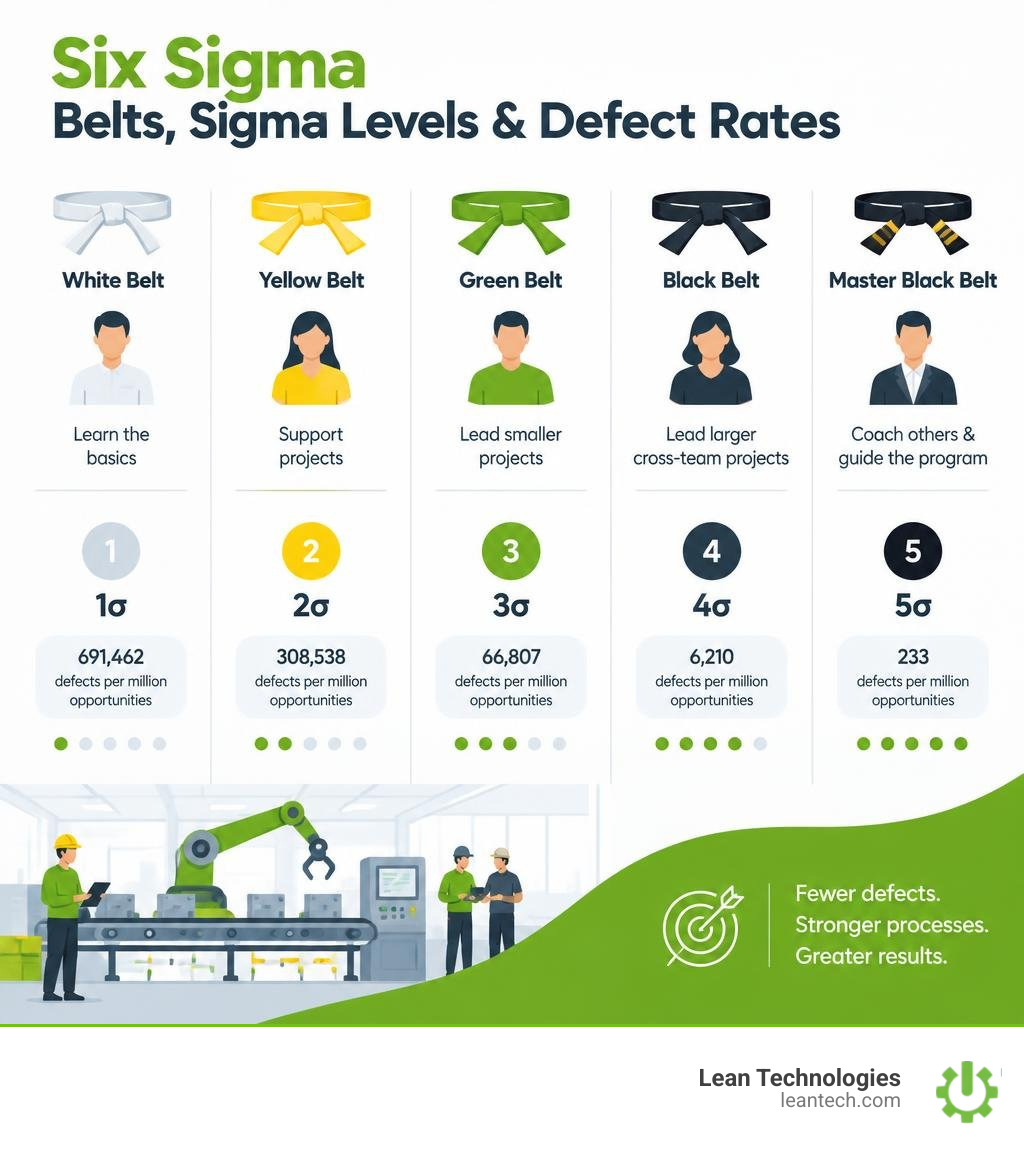
When defects keep showing up on the shop floor, it helps to know both how well the process performs and who can lead the fix. The 6 sigma levels describe process quality, while Six Sigma belts describe training and project roles. White Belts learn the basics, Yellow Belts support projects, Green Belts lead smaller projects, Black Belts lead larger cross-team projects, and Master Black Belts coach others and guide the program.
For process quality, the Six Sigma benchmark is 3.4 defects per million opportunities, using the standard 1.5-sigma shift convention. If you're choosing a path for yourself or your team, match the belt to the work at hand: start with project support, or pursue Green or Black Belt skills when you need someone to lead improvements.
The Statistical Foundation: Understanding 6 Sigma Levels and Defect Rates
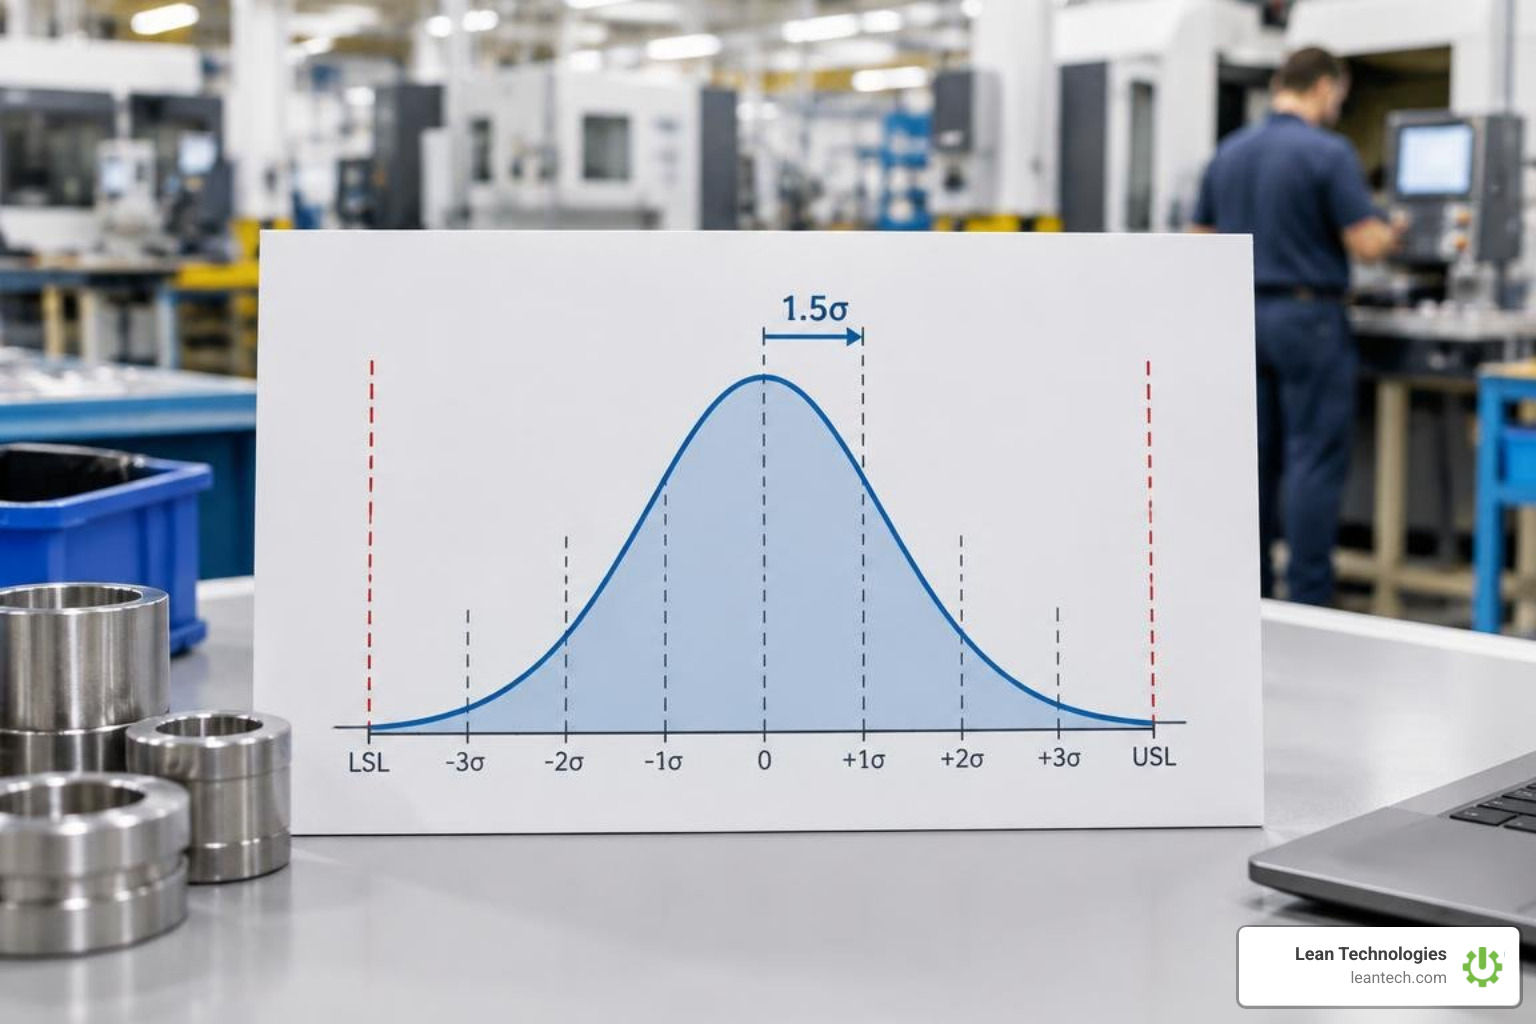
At its core, Six Sigma is a disciplined, data-driven methodology designed to eliminate defects and reduce variation in any process. The Greek letter sigma represents standard deviation, a statistical metric that quantifies how much a process varies around its mean. When operations managers or quality engineers evaluate process capability, they measure how many standard deviations fit between the process average and the customer's acceptable specification limits.
Motorola pioneered this statistical quality framework in 1986, later trademarking it in 1991. The central concept relies on the 1.5 sigma shift. In short-term lab conditions, a process might perform with minimal deviation. Over the long haul, however, real-world shop floors experience environmental fluctuations, raw material variance, tool wear, and operator changes. Motorola's empirical studies showed that typical process averages drift by roughly 1.5 standard deviations over time.
Accounting for this drift is what connects a mathematical normal distribution curve to sustainable operational standards. A comprehensive Six Sigma deployment uses this offset to guarantee that even with normal operational drift, your process consistently produces defect-free output.
Mapping Defect Rates Across 6 Sigma Levels
To track where your processes stand, quality leaders calculate Defects Per Million Opportunities (DPMO). This calculation normalizes defect rates across products of varying complexity:
DPMO = (Total Defects / (Units Inspected × Opportunities per Unit)) × 1,000,000
The table below outlines the mathematical relationship between sigma levels, DPMO, process yield percentages, and shopfloor equivalents:
Sigma Level | Defects Per Million Opportunities (DPMO) | Process Yield (%) | Real-World Operational Context |
|---|---|---|---|
1 Sigma | 691,462 | 30.85% | Uncontrolled process; severe scrap, constant rework. |
2 Sigma | 308,537 | 69.15% | High operational friction; nearly one in three items fails. |
3 Sigma | 66,807 | 93.32% | Average baseline for many unoptimized service processes. |
4 Sigma | 6,210 | 99.38% | Typical manufacturing standard; good, but costly at volume. |
5 Sigma | 233 | 99.98% | High-capability industrial lines and tight-tolerance machining. |
6 Sigma | 3.4 | 99.99966% | World-class benchmark; near-perfection in high-volume runs. |
Moving from 3 Sigma to 6 sigma levels represents a massive reduction in scrap. While a 93.32% yield might sound passable to an untrained eye, 66,807 defects per million opportunities burns through operational margins. At 6 Sigma, producing only 3.4 defects per million opportunities protects customer trust and eliminates secondary inspection loops.
Core Quality Metrics: DPMO, DPU, FTY, RTY, and COPQ
Tracking sigma levels requires a robust suite of shopfloor metrics that connect statistical variation to balance-sheet performance. Reviewing the fundamental Six Sigma Metrics: DPMO, DPU, FTY, RTY, COPQ, and More reveals five critical indicators:
Defects Per Unit (DPU): Measures the average number of flaws found on an individual product (DPU = Total Defects / Total Inspected Units), regardless of how many total opportunities exist.
First Time Yield (FTY): The percentage of units that complete a single production step without needing rework, scrap, or manual adjustment (FTY = Good Units / Total Units Entering Step).
Rolled Throughput Yield (RTY): The probability that a unit passes through an entire multi-step manufacturing sequence defect-free. Calculated by multiplying the FTY of every sequential step (RTY = FTY1 × FTY2 × ... × FTYn), RTY exposes hidden factory rework that single-station metrics obscure.
Cost of Poor Quality (COPQ): Quantifies the financial hit of sub-optimal processes. It encompasses internal failure costs (scrap, rework, downtime), external failure costs (warranty claims, customer returns, recalls), and appraisal/prevention investments.
Process Capability Indices (Cpk vs. Ppk): While Cpk measures potential capability in a stable, in-control process, Ppk captures overall performance across long-term production runs. World-class Six Sigma operations maintain a Cpk equal to or greater than 2.0 (with a minimum threshold of 1.33).
Adopting these metrics forms the basis for integrating continuous improvement tools in quality management, bridging the gap between raw data collection and plant-wide problem-solving.
Six Sigma Belt Hierarchy: Roles, Scope, and Career Progression
Six Sigma organizes operational talent into a martial arts-style belt hierarchy. This structure ensures that projects have the right mix of statistical depth, project management, and executive backing.
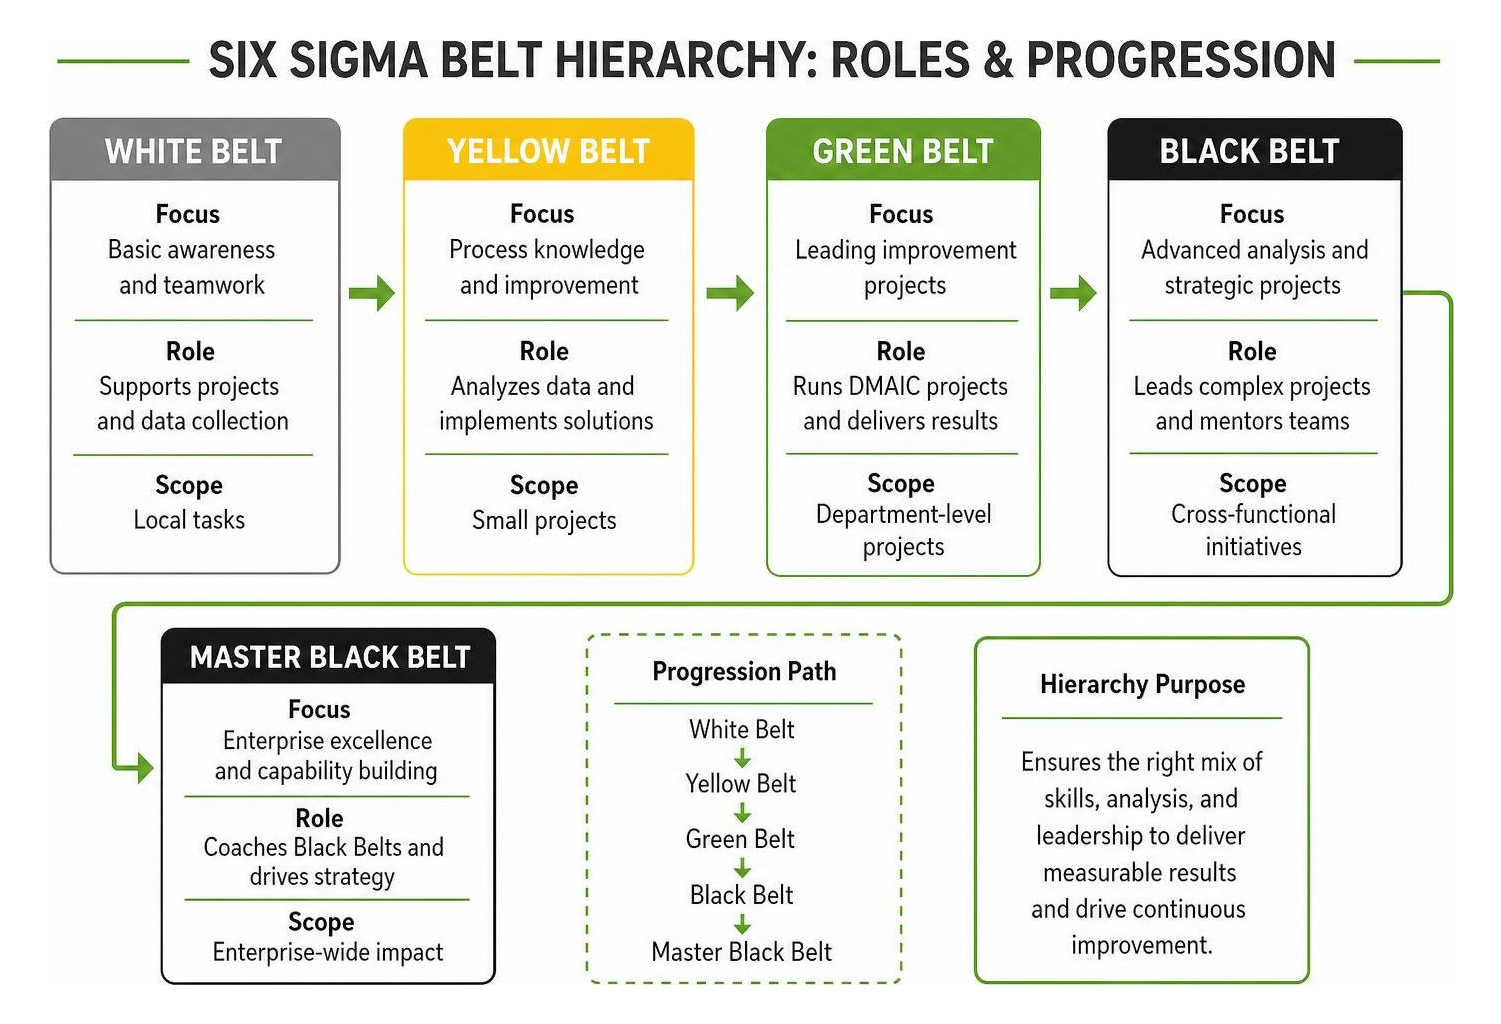
Industry standards set by organizations like ASQ and IASSC establish core competencies across belt tiers, as detailed in this Six Sigma Belt Levels: Complete Guide & Comparison. Exact certification requirements vary by training provider; this guide compares structural roles and operational pathways across the industry.
Across the United States, professionals who complete any level of Six Sigma training earn an average of $16,411 more annually than their non-certified peers. The financial and operational impact increases significantly with each progressive tier.
White Belt and Yellow Belt: Building Foundational Awareness
White Belts understand the high-level vocabulary of quality improvement. Typically completed in a single orientation session, White Belt training introduces basic terminology like waste identification, customer specifications, and basic problem-solving. It helps frontline operators understand why continuous improvement projects occur on their lines.
Yellow Belts take the next step by learning practical process mapping, data collection protocols, and basic root cause analysis tools. A Yellow Belt participates as a core project team member under the direction of Green and Black Belts.
Project Role: Collecting clean shift data, participating in fishbone brainstorming sessions, and monitoring local pilot changes.
Median Advertised Salary: Approximately $85,200 annually, with typical compensation ranges spanning $60,000 to $70,000 depending on industry and operational role.
Green Belt vs. Black Belt: Project Leadership and Scope
The Green Belt and Black Belt levels represent the working engines of any continuous improvement culture. Understanding their differences helps plant managers assign project ownership effectively:
Dimension | Six Sigma Green Belt (CSSGB) | Six Sigma Black Belt (CSSBB) |
|---|---|---|
Project Commitment | Part-time (typically 15% to 25% of regular job duties) | Full-time process improvement and change leader |
Typical Project Scope | Localized work-cell or single department issues | Cross-functional, complex, high-impact enterprise issues |
Statistical Toolset | Descriptive statistics, basic hypothesis tests, capability | Advanced ANOVA, regression, Design of Experiments (DOE) |
Leadership Scope | Leads small frontline teams on tactical workflows | Mentors Green Belts; leads multi-department teams |
Prerequisites | Foundational analytical aptitude; 1-3 years experience | Green Belt or 3+ years experience; completed projects |
Median Advertised Salary | $95,600 (typical range: $70,000 – $90,000+) | $120,200 (typical range: $100,000 – $130,000+) |
Annual Salary Premium | +$10,736 over non-certified peers | +$15,761 over non-certified peers |
Green Belts excel at running targeted floor projects and driving shopfloor events like 6 Sigma Kaizen blitzes. In contrast, Black Belts tackle systemic bottlenecks that span supply chain, engineering, and assembly operations, frequently delivering hundreds of thousands of dollars in verified project savings.
Master Black Belts, Champions, and Executives: Strategic Governance
High-performing continuous improvement deployments rely on strong leadership and organizational support:
Master Black Belt (MBB): The technical authority and program mentor. MBBs advise executive leadership, train and coach Black and Green Belts, and ensure statistical tools are applied correctly across project portfolios. They earn average salaries between $140,000 and $200,000+, commanding an average $26,123 annual salary premium over non-certified professionals.
Six Sigma Champion: Senior managers or directors who own the operational process. Champions do not run daily regression models; instead, they define high-impact project scopes, remove organizational hurdles, allocate departmental budget and labor, and ensure process owners sustain verified improvements.
Six Sigma Executive: C-suite leaders who align quality initiatives with corporate growth targets. They set enterprise-wide quality benchmarks, sponsor program deployments, and hold operational divisions accountable for return on investment.
Executing DMAIC to Advance Through 6 Sigma Levels
To move a manufacturing or transactional process up the sigma ladder, teams use DMAIC (Define, Measure, Analyze, Improve, Control). This structured problem-solving cycle keeps projects grounded in verified facts rather than guesswork.

Define, Measure, and Analyze: Pinpointing Variation
Define: Teams establish the project charter, identify customer requirements (Voice of the Customer or VOC), and translate them into measurable Critical to Quality (CTQ) parameters. Mapping high-level workflows using SIPOC (Suppliers, Inputs, Process, Outputs, Customers) clarifies operational boundaries.
Measure: Before trusting shift data, teams perform Measurement System Analysis (Gage R&R) to ensure that inspection tools and operator techniques are repeatable and reproducible. Once verified, teams measure the process baseline, collecting defect data to calculate starting DPMO and Cpk baselines.
Analyze: Using tools like Pareto charts, Value Stream Maps, Ishikawa (fishbone) diagrams, and the 5 Whys, project leads isolate root causes of variation. Black Belts deploy multi-vari charts, confidence intervals, and hypothesis testing to validate relationships with statistical evidence, using proven continuous improvement tools Six Sigma to target real points of failure.
Improve and Control: Sustaining High Sigma Performance
Improve: Once the vital root causes are proven, teams formulate and validate countermeasures. Teams use Design of Experiments (DOE) to establish optimal machine set points, balance line flow, and implement physical mistake-proofing (poka-yoke) devices.
Control: The final phase prevents gains from eroding over time. The team establishes Standard Operating Procedures (SOPs), updates training matrices, and deploys Statistical Process Control (SPC) control charts.
By integrating modern Lean Six Sigma frameworks, operations teams combine Six Sigma's variation reduction with Lean's speed and waste elimination.
Navigating Real-World Challenges and Criticisms of Six Sigma
While Six Sigma has generated billions in verified savings—Motorola documented over $17 billion by 2005, and General Electric achieved over $1 billion in cost reductions—the methodology faces legitimate criticisms when applied dogmatically:
Bureaucratic Overhead and Analysis Paralysis: Teams can spend months building elaborate statistical models for obvious mechanical fixes. If a project takes six months to solve a problem that an experienced maintenance technician could address in two days, the methodology becomes a bottleneck.
Risk of Stifling Innovation: Over-indexing on incremental variance reduction can blind organizations to disruptive changes. Six Sigma optimizes existing processes; it does not invent brand-new product concepts.
High Project Failure Rates: Initiatives often stall when leadership treats Six Sigma as an isolated corporate program rather than a daily operational habit. When Black Belt projects rely on static binders, complex spreadsheets, and disconnected data, frontline supervisors struggle to maintain control plans.
Over-Reliance on Theoretical Assumptions: Assuming every dataset follows a standard normal distribution or rigidly applying the 1.5 sigma shift without validating actual operational drift leads to flawed conclusions.
The solution is balancing statistical rigor with agile shopfloor execution. CI managers and QA leaders need lightweight, practical tools that capture clean defect data at the machine source without burying operators in paperwork.
Frequently Asked Questions About 6 Sigma Levels
What is the defect rate associated with a 6 Sigma process?
A Six Sigma process generates no more than 3.4 defects per million opportunities (DPMO), which equals a 99.99966% defect-free yield. This calculation accounts for the standard 1.5 sigma long-term process shift, ensuring that even with typical operational drift over time, output stays within customer specification limits.
How do Six Sigma belt certifications impact salary potential?
Six Sigma credentials carry documented market value across manufacturing, healthcare, supply chain, and IT:
Yellow Belt: Median advertised salary of $85,200.
Green Belt: Median advertised salary of $95,600 (average salary premium of +$10,736).
Black Belt: Median advertised salary of $120,200 (average salary premium of +$15,761).
Master Black Belt: Compensation ranges from $140,000 to $200,000+ (average salary premium of +$26,123).
Can an organization skip belt levels during Six Sigma implementation?
Yes. Individuals and organizations do not need to follow a rigid White-to-Master Black Belt sequence. Many engineers and operations supervisors with strong analytical backgrounds skip directly to Green Belt or Black Belt training. However, candidates pursuing advanced Black Belt credentials typically need verified project experience demonstrating measurable financial or quality improvements.
What to Do Next
Achieving higher sigma levels is not just about crunching historical data—it requires disciplined, daily execution on the plant floor. Quality engineers, maintenance technicians, and operations managers need reliable visibility into shopfloor defects as they happen.
To close the loop on continuous improvement, manufacturers use Thrive by Lean Technologies. Built as a flexible digital toolbox for small to midsize manufacturers, Thrive digitizes lean work processes to help operators and supervisors log issues, track corrective actions, and support ongoing improvement projects.
Thrive is not an ERP or MES and does not replace your existing enterprise systems. It does not collect direct sensor data or run predictive alerts; instead, it organizes and drives clear action from machine and production data entered by your team or imported from existing systems. By capturing scrap reasons, downtime logs, and standard work checks directly at the source via mobile, tablet, or desktop, Thrive gives continuous improvement teams the real-time visibility needed to sustain high 6 sigma levels across every shift.