

Lean Six Sigma Survival Guide
Core Principles and Origins of Lean Six Sigma
Modern manufacturing leaders know that process excellence is not built on guesswork. The roots of Lean Six Sigma stem from two distinct industrial philosophies that converged to address two sides of the same operational coin: waste and inconsistency.
The Lean component originated within the Toyota Production System (TPS) during the 1950s under the guidance of leaders like Taiichi Ohno and Shigeo Shingo. Lean zeroed in on eliminating non-value-added activities, balancing flow, and respecting frontline operator intelligence. Decades later, in 1986, Motorola engineer Bill Smith introduced Six Sigma to tackle chronic defects through rigorous statistical modeling. The methodology gained widespread commercial recognition throughout the 1990s when General Electric (GE) embedded it across its operations, documenting over $12 billion in savings within five years. Motorola alone achieved more than $16 billion in savings across its first decade of deployment.
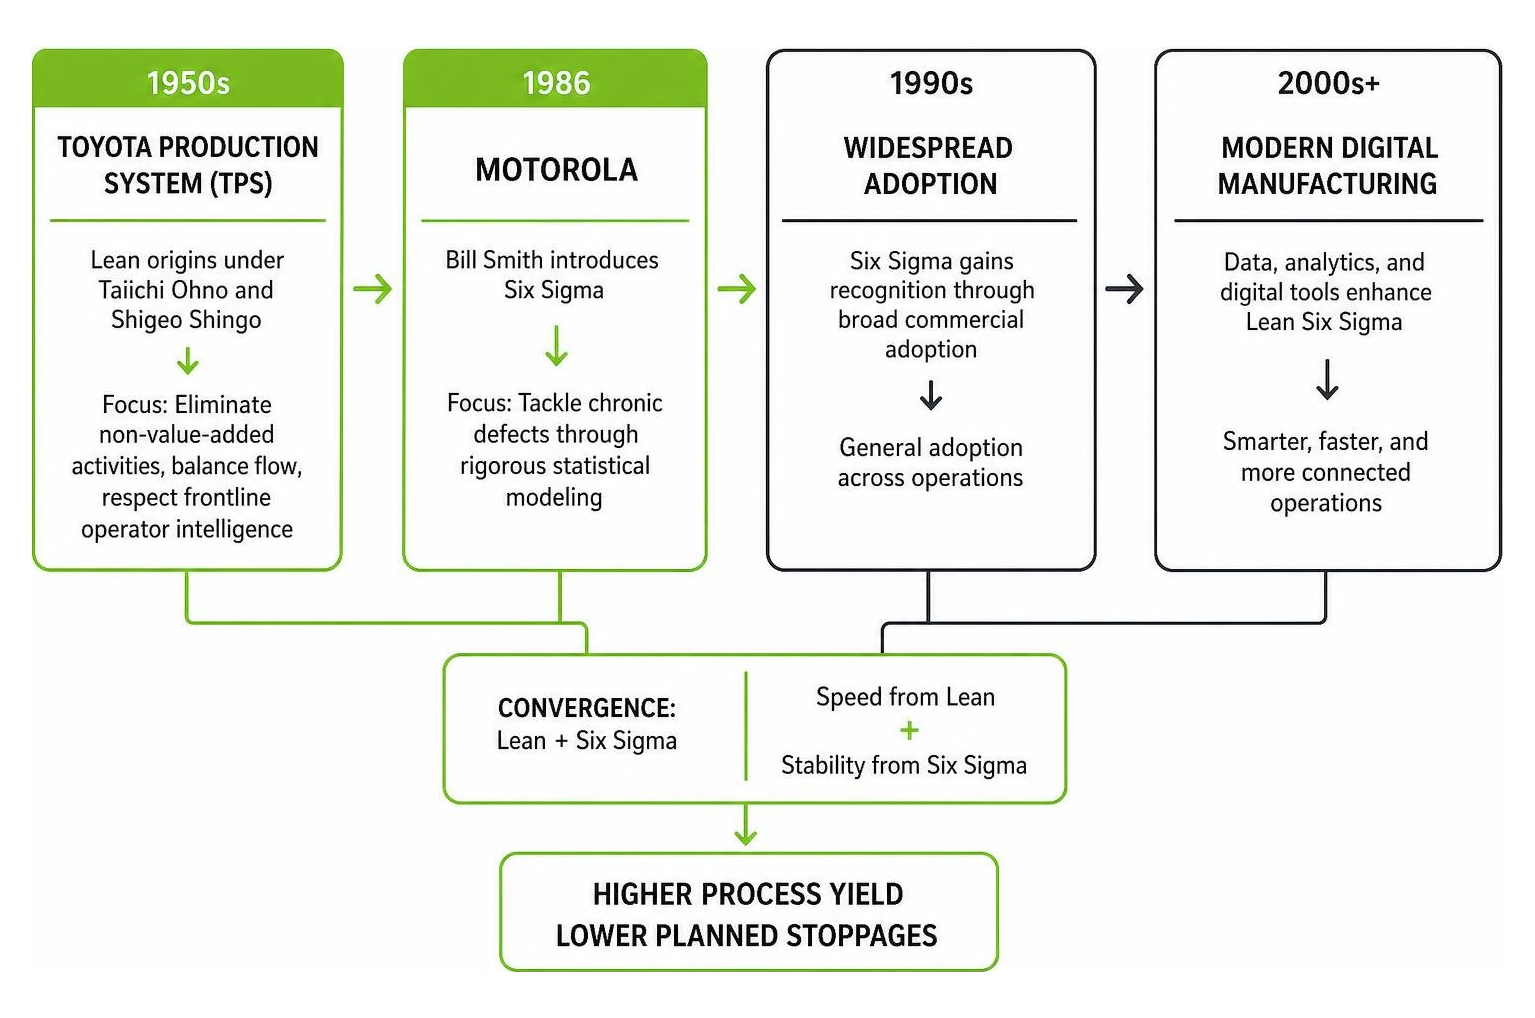
By the early 2000s, practitioners realized that applying either system alone left blind spots. Lean removed obvious bottlenecks but lacked statistical tools to diagnose deep, hidden variations. Six Sigma eradicated defects but often ignored process velocity and inventory buildup. Academic research, such as studies on the parametric multi-level modeling of Lean Six Sigma, demonstrates how uniting leanness with statistical variation reduction creates a compounding operational effect, driving higher process yield and slashing planned stoppages.
When you implement a structured Lean Production System, you establish standard operating baselines that make variations instantly noticeable. By merging speed with stability, your teams can diagnose issues systematically rather than relying on reactive fire drills.
Lean Six Sigma vs Traditional Six Sigma and Lean Alone
Understanding how these disciplines intersect helps production and continuous improvement (CI) managers pick the right approach for specific shopfloor challenges:
Lean Focus: Prioritizes process speed, workflow balance, and waste eradication. It aims to shorten the timeline between customer order and shipment by removing non-value-added steps.
Six Sigma Focus: Prioritizes precision, repeatability, and defect elimination. It uses advanced data tools to eliminate variation in critical parameters.
Lean Six Sigma Synergy: Targets both velocity and variability simultaneously, ensuring processes run fast without generating out-of-spec products.
Characteristic | Lean Manufacturing | Traditional Six Sigma | Lean Six Sigma (LSS) |
|---|---|---|---|
Primary Focus | Eliminating waste, boosting flow | Reducing defects, minimizing variation | Maximizing value velocity and quality |
Primary Goal | Shorter lead times, lower inventory | High process capability, zero defects | High-yield, agile, predictable output |
Approach | Visual, flow-oriented, shopfloor-led | Data-intensive, statistical, analytical | Unified empirical problem-solving |
Typical Tools | 5S, Kanban, Value Stream Mapping | Control charts, ANOVA, DoE, Gage R&R | DMAIC, SIPOC, Poka-Yoke, Control Plans |
Execution Speed | Rapid kaizen sprints (days to weeks) | Structured projects (months) | Targeted DMAIC cycles (weeks to months) |
Combining these disciplines ensures that when you accelerate cycle times using standard continuous improvement practices, you do not inadvertently speed up the generation of defective parts.
The 8 Shop Floor Wastes and Statistical Variation
To eliminate inefficiencies, teams must know how to spot the 8 wastes of Lean, easily remembered by the DOWNTIME mnemonic:
Defects: Scrap, rework, or incorrect assemblies that consume raw material and labor.
Overproduction: Fabricating components before downstream workstations or customers actually require them.
Waiting: Unplanned machine downtime, delayed material deliveries, or operators waiting for supervisory sign-offs.
Non-Utilized Talent: Overlooking the technical problem-solving capabilities of operators and maintenance technicians.
Transportation: Unnecessary movement of raw materials, work-in-progress (WIP), or finished goods across facilities.
Inventory: Excess buffer stock masking underlying line bottlenecks and tieing up working capital.
Motion: Poorly laid out workstations forcing operators to reach, bend, walk, or search for tools.
Extra-Processing: Performing unnecessary operations, excessive polishing, or redundant inspections that add zero customer value.
Six Sigma complements waste elimination by targeting statistical variation. A classic 3-sigma process generates roughly 66,800 defects per million opportunities (DPMO). In contrast, true Six Sigma capability limits defects to no more than 3.4 DPMO, achieving a 99.99966% success rate.

By driving down standard deviation ($\sigma$) and stabilizing process capability ($Cp$ and $C{pk}$), your plant moves from inspecting quality out of products to designing quality into operations.
The DMAIC Framework: Step-by-Step Project Roadmap
The DMAIC framework (Define, Measure, Analyze, Improve, Control) is the structured roadmap used to solve complex, recurring manufacturing problems.
According to a survey by the American Society for Quality (ASQ), organizations executing structured projects report median cost savings between $50,000 and $200,000 per project. Applying the continuous improvement guide roadmap alongside baseline resources from institutions explaining what is Lean Six Sigma gives your team a clear, repeatable project lifecycle.
Define, Measure, and Analyze: Pinpointing Process Defects
The front half of DMAIC prevents teams from jumping to premature conclusions:
Define: Establish a concrete Project Charter that articulates the business problem, financial impact, project scope, and target metrics. Tools like a SIPOC diagram (Suppliers, Inputs, Process, Outputs, Customers) define process boundaries, while Voice of the Customer (VOC) translates client requirements into Critical to Quality (CTQ) parameters.
Measure: Map the current state using detailed Value Stream Mapping (VSM) and establish a clear data collection plan. Teams measure baseline defect counts, cycle times, and scrap rates. Evaluating measurement systems (Gage R&R) ensures data integrity before running calculations.
Analyze: Uncover underlying root causes rather than treating visible symptoms. Cross-functional teams apply continuous improvement tools like:
Pareto Charts (80/20 Rule): Identifying the vital few defect categories causing the majority of scrap.
Ishikawa (Fishbone) Diagrams & 5 Whys: Categorizing potential root causes across Machines, Methods, Materials, Measurement, Environment, and People.
Failure Mode and Effects Analysis (FMEA): Ranking risks by Severity, Occurrence, and Detection scores.
Improve and Control: Implementing and Sustaining Gains
Once root causes are proven with process data, the final phases turn insights into permanent habits:
Improve: Formulate, test, and validate targeted countermeasures. Solutions may include poka-yoke (error-proofing) fixtures, visual kanban controls, and redesigned single-minute exchange of die (SMED) changeover routines. Run controlled pilot tests on a single production line to evaluate performance shifts before executing plant-wide rollout.
Control: Without robust controls, processes inevitably slip backward into old workarounds. Lock in performance gains by:
Drafting unambiguous Standard Operating Procedures (SOPs).
Installing Statistical Process Control (SPC) charts at operator stations to monitor key parameters in real time.
Establishing explicit Control Plans specifying who reacts, how fast, and with what corrective action whenever metrics drift outside control limits.
Certification Hierarchy and Organizational Roles
Lean Six Sigma relies on a belt-based skill hierarchy to drive projects, balance resources, and maintain accountability across leadership and frontline teams.

The 5 Belt Levels in Lean Six Sigma Certification
Each certification level corresponds to specific competencies and operational responsibilities:
White Belt: Foundational awareness. White belts understand core concepts, vocabulary, and the importance of waste reduction, helping support local continuous improvement ideas.
Yellow Belt: Active project participants. Yellow belts review process maps, log shopfloor data, participate in root-cause sessions, and champion 5S and standard work in their immediate areas.
Green Belt: Project leaders. Green Belts lead scoped DMAIC projects within their functional departments (typically 3 to 6 months long) while maintaining their primary operational roles as QA engineers, production supervisors, or maintenance technicians.
Black Belt: Full-time continuous improvement leaders. Black Belts lead complex, high-impact cross-functional initiatives, apply advanced regression and design of experiments (DoE), and coach Green Belts.
Master Black Belt: Strategic advisors. Master Black Belts partner with executive leadership, oversee enterprise CI strategy, develop training curricula, and ensure project portfolios match business objectives.
Driving Cultural Adoption Across Frontline Teams
Belts and statistical tools deliver value only when frontline personnel are actively engaged. Sustainable operational improvement requires:
Daily Standups & Tiered Meetings: Operators and supervisors reviewing daily scrap, cycle time trends, and active containment tasks directly at visual boards.
Gemba Walks: Operations, Maintenance, and Quality managers walking the actual production line to observe workflows directly, listen to operator feedback, and identify physical bottlenecks.
Fast Feedback Loops: When an operator logs a recurring mechanical defect or material issue, the continuous improvement pipeline must assign an owner and show visible progress promptly.
Common Pitfalls and How to Avoid Implementation Traps
Despite its proven track record, initiatives can stall if plants fall into classic execution traps:
Analysis Paralysis: Spending months perfecting complex statistical models instead of implementing immediate shopfloor improvements. Avoid this by matching tool complexity to problem severity.
Disconnected Paper Logs & Spreadsheets: Gathering shift notes, downtime logs, and inspection records on paper clipboards guarantees that data remains isolated and forgotten. Adopting modern digital lean manufacturing strategies ensures data is collected at the source and immediately visible to decision-makers.
Ignoring the Control Phase: Celebrating a project victory immediately after running a pilot, only to watch scrap rates creep back to original levels months later because no control plan or visual standard was maintained.
Lack of Frontline Ownership: Designing changes in an isolated office without input from production operators, leading to resistance, poor adherence, and eventual abandonment of new procedures.
Frequently Asked Questions
Is this methodology still relevant for modern manufacturers in 2026?
Yes. While smart factory tools and digital platforms have advanced, the foundational issues of scrap, unplanned downtime, and process variation remain. In 2026, modern manufacturers use real-time digital entry and structured problem solving to execute DMAIC cycles faster and with greater accuracy than paper-based plants ever could.
How long does a typical DMAIC project take to complete?
A well-scoped Green Belt project typically takes 3 to 6 months from initial charter sign-off to full implementation of the control phase. Larger Black Belt initiatives addressing complex cross-departmental supply chain or yield challenges may run from 6 to 12 months.
What is the difference between a Kaizen sprint and a DMAIC project?
A Kaizen sprint is a focused 3-to-5-day event targeting an obvious, well-understood issue (such as organizing a tooling area via 5S or standardizing a changeover). A DMAIC project is a longer, data-driven investigation used when the true root cause of a defect or variation is unknown and requires systematic measurement and statistical validation.
What to do next
Transforming operational chaos into predictable, high-yield production starts with giving your teams the tools to see problems clearly and take structured action.
To turn theory into shopfloor reality:
Identify a manageable pilot line: Select an area experiencing persistent rework, bottlenecking, or downtime.
Standardize data capture: Equip operators and technicians to log issues and scrap reasons at the source rather than relying on delayed paperwork.
Execute a targeted DMAIC cycle: Form a cross-functional team, measure the baseline performance, isolate root causes, and deploy error-proof countermeasures.
Digitize your action tracking: Explore practical lean six sigma software tools that keep standard operating procedures, audits, and corrective actions visible to everyone.
Thrive provides an intuitive digital toolbox designed for small to midsize manufacturers. It is not an ERP or MES, and it is not intended to replace existing ERP or MES systems. Instead, Thrive digitizes lean work processes to help operators and supervisors log issues, track actions, and drive continuous improvement. By replacing scattered clipboards and isolated spreadsheets with accessible mobile and tablet workflows, your frontline teams can log issues instantly, track corrective actions collaboratively, and sustain Lean Six Sigma performance gains across every shift.