
A Practical Guide to 6 Sigma Kaizen Integration for Frontline Teams
Kaizen vs. Six Sigma: Understanding the Core Differences
Integrating 6 sigma kaizen practices into your daily operations bridges the gap between grassroots problem-solving and rigorous statistical analysis, giving plant personnel the exact tools needed to eliminate waste, stabilize processes, and sustain long-term operational performance.
To build an effective continuous improvement program, plant leaders must understand how Kaizen and Six Sigma differ in scope, philosophy, and execution. As explored in Chapter 5: Kaizen Philosophy and Tools for Continuous Improvement – Applying Lean Six Sigma for Operational Excellence, the Kaizen philosophy is centered on continuous, incremental improvement driven by everyone across the organization—from frontline assemblers to executive leadership. Kaizen assumes that the people performing the work daily possess the greatest insight into hidden waste, making it an intrinsically bottom-up culture.
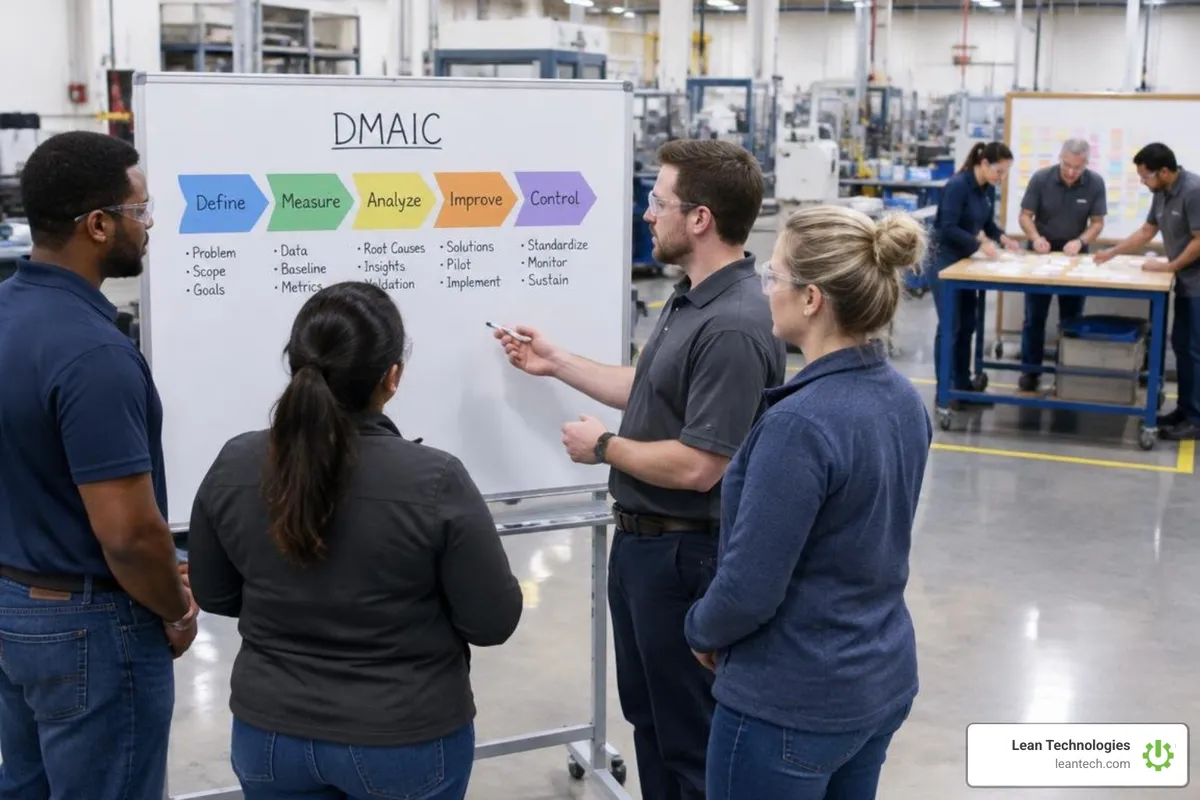
In contrast, Six Sigma is an engineering-driven, top-down methodology created to eliminate process variation and eradicate defects. Six Sigma operates through the rigorous five-phase DMAIC framework (Define, Measure, Analyze, Improve, Control) and targets a defect rate of no more than 3.4 defects per million opportunities (DPMO). While Six Sigma relies heavily on advanced statistical tools, hypothesis testing, and certified Green or Black Belts, Kaizen prioritizes rapid, low-cost experimentation directly at the work center.
Dimension | Kaizen Approach | Six Sigma Approach |
|---|---|---|
Primary Focus | Waste elimination (Muda), flow, and daily incremental refinement | Defect reduction, variance reduction, and process stability |
Scope & Velocity | Targeted, rapid cycles (hours, days, or 1-week events) | Broad, complex, systemic projects (2 to 6 months) |
Methodology | Plan-Do-Check-Act (PDCA) / Scientific Method | Define-Measure-Analyze-Improve-Control (DMAIC) |
Ownership | Frontline operators, supervisors, and cross-functional teams | Black Belts, Green Belts, quality engineers, and project champions |
Investment Level | Low capital, operational changes, standard work updates | Moderate-to-high capital, re-engineering, tooling changes |
Data Reliance | Direct observation (Gemba), visual tracking, basic metrics | Advanced statistics, gauge R&R, regression, capability indices |
Understanding these distinctions helps operations teams deploy an integrated lean six sigma framework rather than treating them as competing methodologies.
Why 6 Sigma Kaizen Synergy Delivers Breakthrough Operational Excellence
Relying exclusively on Six Sigma often leads to project paralysis: teams spend months gathering data while daily operational waste continues unchecked. Conversely, relying solely on Kaizen can result in treating visible symptoms while missing deep-seated, multivariate root causes. Merging both approaches gives manufacturing teams a powerful hybrid advantage.
When you integrate rapid frontline waste elimination with statistical defect reduction, you unlock major operational benefits:
Accelerated Project Velocity: Teams use rapid Kaizen cycles to test countermeasures inside the DMAIC "Improve" phase, delivering quick wins rather than waiting months for final validation.
Higher Sustainment Rates: Lean Six Sigma projects that embed frontline Kaizen habits see an estimated 30% higher sustainment rate because operators take active ownership of the new standard procedures.
Active Shop Floor Engagement: Frontline operators stay engaged because their practical ideas are implemented immediately, bridging the communication gap between engineering desks and production lines to achieve operational excellence.
Integrating Core Kaizen Tools into the Six Sigma DMAIC Framework
A successful continuous improvement strategy integrates shop floor tools directly into each phase of the Six Sigma DMAIC lifecycle.
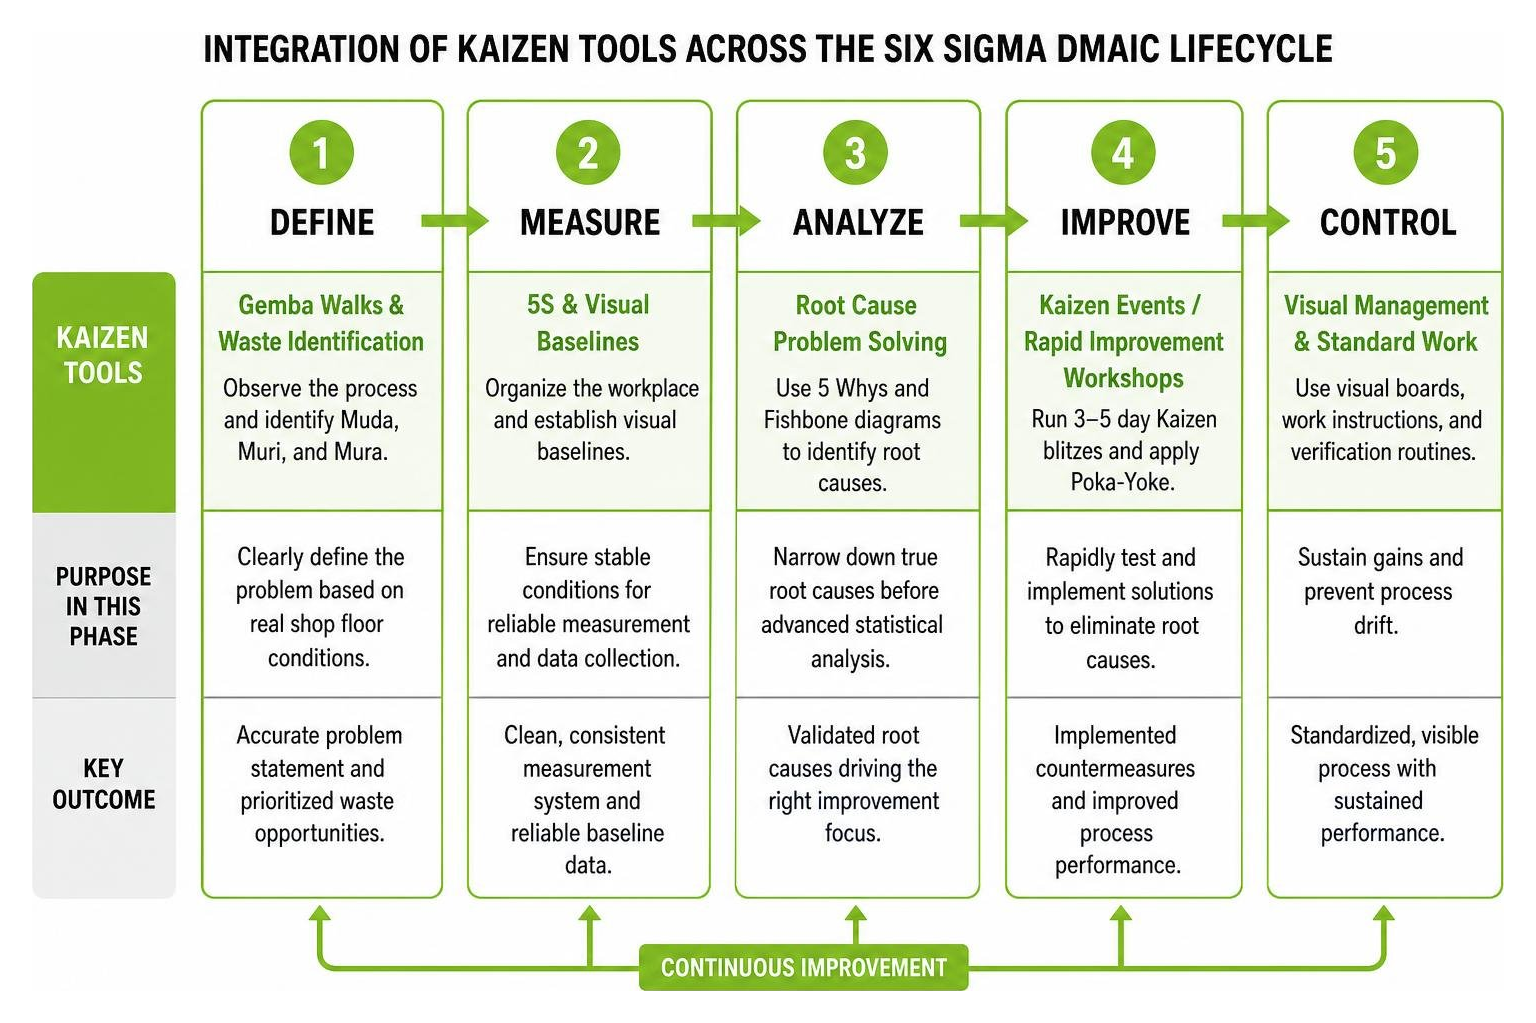
Define Phase (Gemba Walks & Waste Identification): Instead of defining problems inside a conference room, leaders conduct structured Gemba walks to observe where work actually happens. This reveals the classic categories of operational waste: Muda (non-value-adding waste), Muri (operator or machine overburden), and Mura (unevenness in workflow).
Measure Phase (5S & Visual Baselines): Robust statistical analysis requires stable baseline conditions. Applying workplace organization through 6s in lean standardizes tool locations, staging areas, and workstation setups, ensuring measured cycle times reflect true process capability rather than random shop floor disorganization.
Analyze Phase (Root Cause Problem Solving): Teams apply foundational continuous improvement tools six sigma specialists rely on—such as 5 Whys and Fishbone diagrams—to narrow down root causes before running complex statistical regressions.
Improve Phase (Kaizen Events / Rapid Improvement Workshops): Instead of long design cycles, teams run 3- to 5-day Kaizen blitzes to test physical mockups, reconfigure cells, and trial error-proofing mechanisms (Poka-Yoke).
Control Phase (Visual Management & Standard Work): Gains are locked in using digital visual boards, updated visual work instructions, and supervisor verification routines to prevent processes from drifting backward.
The Six-Step Kaizen Procedure Mapped to the PDCA Cycle
As detailed in The Six-Step Kaizen Procedure | Art of Lean, continuous improvement follows a structured scientific sequence. Rather than jumping straight to solutions, frontline teams work through six disciplined steps that map directly onto Deming’s Plan-Do-Check-Act (PDCA) cycle:
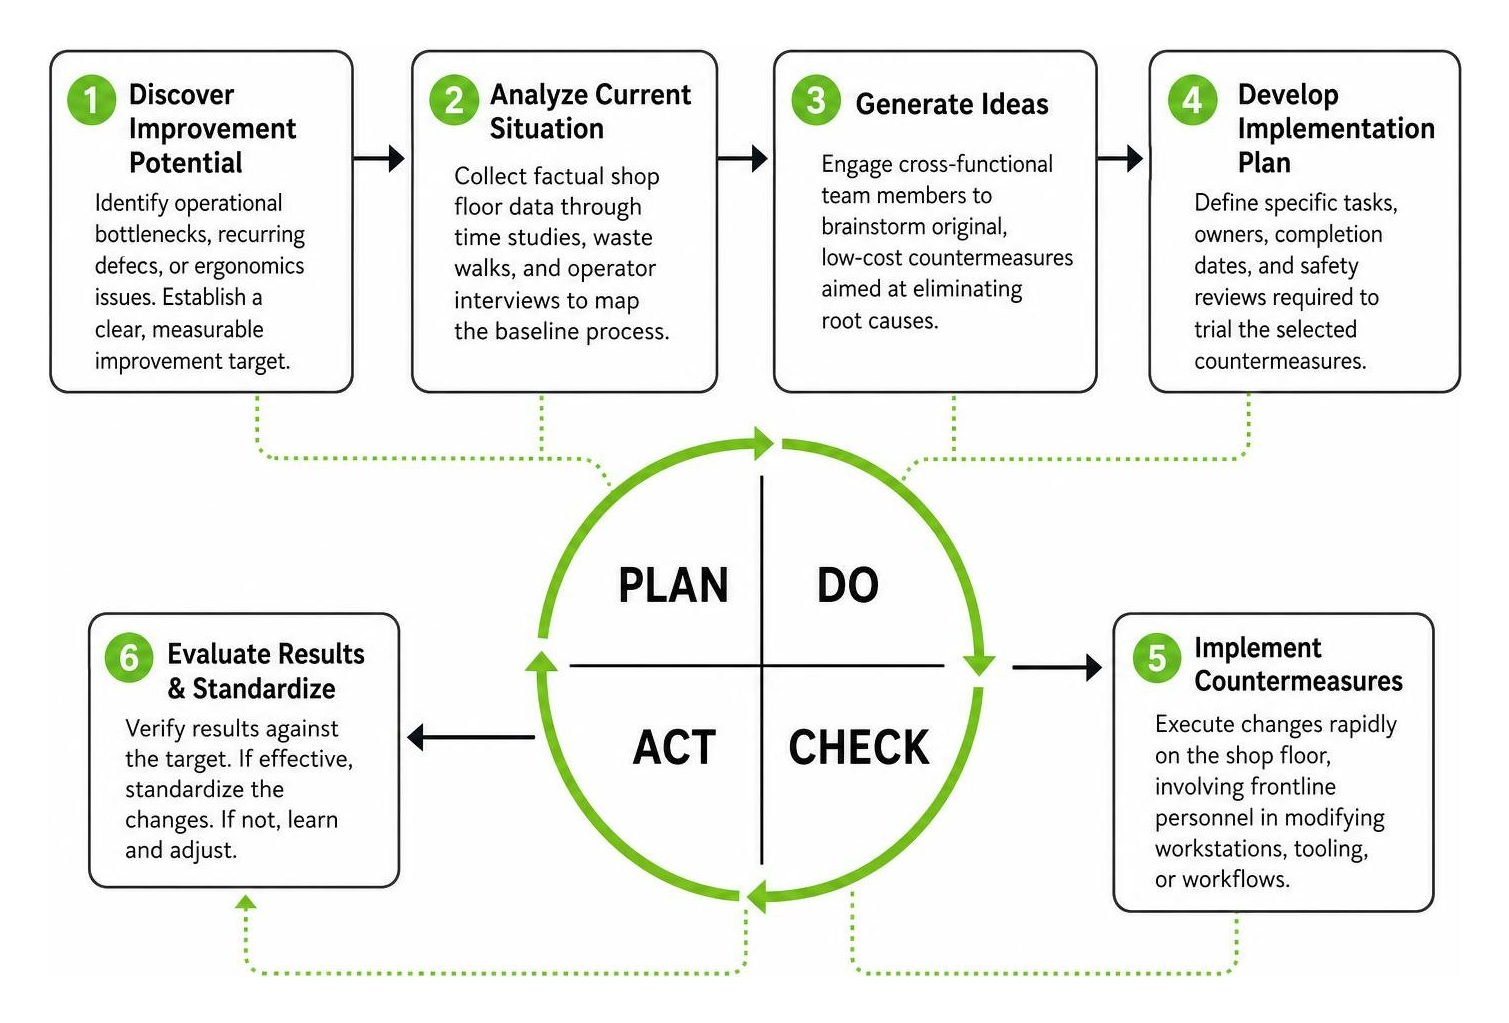
Step 1: Discover Improvement Potential (Plan): Identify operational bottlenecks, recurring quality defects, or ergonomics issues, and establish a clear, measurable improvement target.
Step 2: Analyze Current Situation (Plan): Collect factual shop floor data through time studies, waste walks, and operator interviews to map the baseline process without assumptions.
Step 3: Generate Ideas (Plan): Engage cross-functional team members to brainstorm original, low-cost countermeasures aimed at eliminating root causes.
Step 4: Develop Implementation Plan (Plan): Define specific tasks, owners, completion dates, and safety reviews required to trial the selected countermeasures.
Step 5: Implement Countermeasures (Do): Execute changes rapidly on the shop floor, involving frontline personnel in modifying workstations, tooling, or workflows.
Step 6: Evaluate Results & Standardize (Check & Act): Measure post-implementation performance against Step 1 targets. If successful, update your standard work software documentation, train all shifts, and initiate the next improvement cycle.
Root Cause Analysis: 5 Whys and Fishbone Diagrams in 6 Sigma Kaizen Projects
Jumping to quick fixes without verifying root causes is one of the most common pitfalls in operational environments. Kaizen and Six Sigma resolve this by pairing qualitative frontline brainstorming with data verification.
When diagnosing complex issues, teams combine this technique with an Ishikawa (Fishbone) Diagram to categorize potential drivers across the 6M framework:
Manpower: Gaps in operator training, shift handoff miscommunications, or fatigue.
Machine: Spindle wear, inadequate lubrication, or sensor calibration drift.
Method: Inconsistent standard operating procedures or poor tooling setup sequences.
Material: Raw stock hardness variation or out-of-spec incoming alloy batches.
Measurement: Uncalibrated micrometers or operator visual inspection fatigue.
Milieu (Environment): Ambient shop temperature swings affecting hydraulic viscosity.
Frontline teams apply structured problem solving 101 techniques to brainstorm causes across these branches, then verify them with collected process data rather than stopping at surface-level human error. Teams can easily organize these investigations using root cause analysis software to track corrective actions through completion.
Visual Management and Flow: Kaizen Boards, Kanban, and WIP Optimization
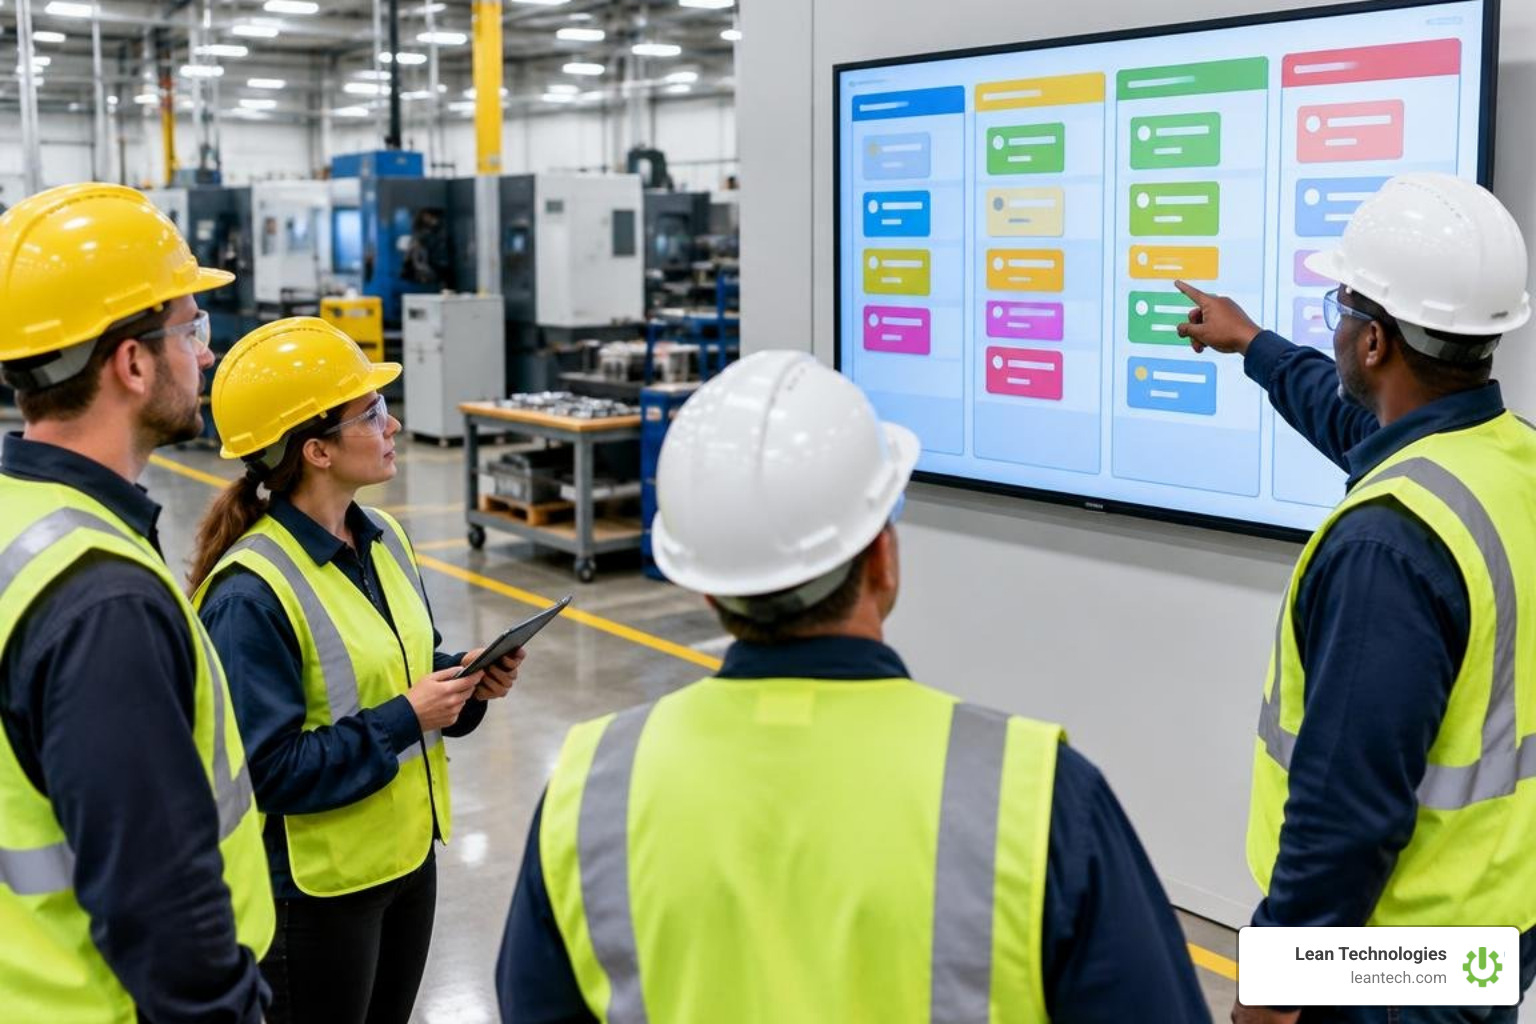
Visual management creates immediate operational transparency across the shop floor. Two visual tools frequently used in continuous improvement are Kaizen Boards and Kanban Boards. While both rely on visual cards, they serve distinctly different operational purposes.
Operational Attribute | Kaizen Board | Kanban Board |
|---|---|---|
Core Objective | Tracking improvement ideas, root cause analyses, and PDCA actions | Regulating daily material movement, work scheduling, and line flow |
Item Lifecycle | Ephemeral: starts as an idea, moves through execution, closes upon standardization | Continuous: units, batches, or tasks replenish repeatedly in a pull system |
Card Content | Problem description, root cause, countermeasure, assigned owner, target date | Part number, batch quantity, upstream source, downstream destination |
Primary Metric | Action closure rate, Kaizens completed per month, cost/time saved | Cycle time, Lead time, Work-in-Process (WIP), On-time delivery (OTD) |
Audience | CI teams, shift supervisors, safety and quality review groups | Material handlers, cell operators, production schedulers |
Deploying digital visual management alongside dedicated kanban board tool setups gives teams visibility into both continuous improvement initiatives and real-time production flow.
Determining Kanban Capacity and Setting Work-in-Process (WIP) Limits
Controlling inventory between workstations is essential for maintaining smooth line flow. Excessive Work-in-Process (WIP) hides line imbalances, scrap, and machine reliability issues. To optimize workflow, operations leaders use Little's Law:
$$\text{Lead Time} = \frac{\text{Work-in-Process (WIP)}}{\text{Throughput}}$$
To establish effective WIP limits on a pull board:
Calculate Baseline Capacity: Measure actual throughput across each workstation over several shifts.
Identify the Constraint: Locate the line bottleneck (the slowest dependent process step).
Set Initial WIP Caps: Set WIP limits equal to or slightly below available station capacity (a solid starting point is 1 to 1.5 times the number of operators per cell).
Monitor and Adjust: If cycle times spike or operators experience starvation, review your how to improve manufacturing efficiency best practices tools to adjust WIP limits based on measured lead-time data.
Takt Time Calculation: Aligning Frontline Flow with Customer Demand
Takt Time represents the operational heartbeat of a lean facility. It defines the maximum allowable time to produce a single unit to meet customer demand exactly.
$$\text{Takt Time} = \frac{\text{Net Available Operating Time per Shift}}{\text{Customer Demand per Shift}}$$
Practical Takt Time Calculation Example
Consider an electronics sub-assembly work cell operating under the following parameters:
Total Shift Length: 8 Hours (480 minutes)
Planned Downtime: Two 15-minute breaks + 10-minute daily shift meeting = 40 minutes
Net Available Time: $480 - 40 = 440\text{ minutes}\times 60 = 26,400\text{ seconds}$
Customer Demand: 440 units per shift
$$\text{Takt Time} = \frac{26,400\text{ seconds}}{440\text{ units}} = 60\text{ seconds per unit}$$
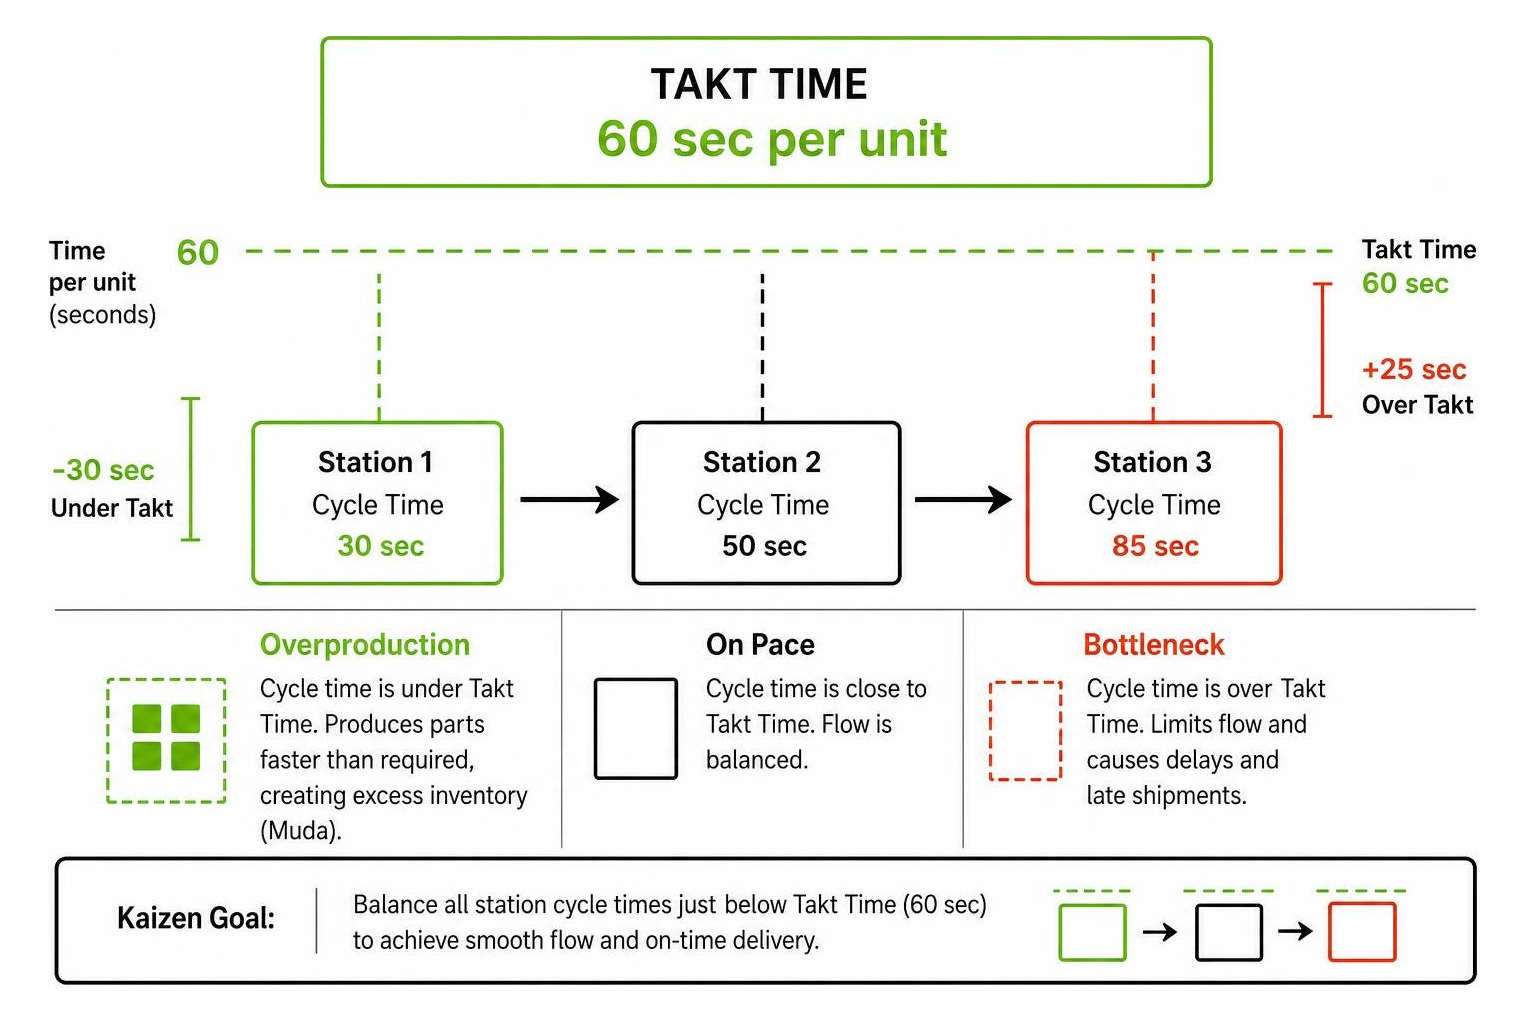
If an upstream station runs at a Cycle Time of 30 seconds, it produces parts at twice the required rate, creating excess inventory (Muda of Overproduction). If a downstream station has a Cycle Time of 85 seconds, it creates a bottleneck, causing late shipments. Kaizen events balance these stations, bringing individual cycle times just below Takt Time to establish a stable lean production system.
Practical Implementation: Executing 6 Sigma Kaizen on the Shop Floor

Executing continuous improvement on the shop floor requires moving away from disconnected paperwork and isolated spreadsheets. Daily continuous improvement thrives when leadership standard routines support real-time frontline participation.
Operational leaders drive this engagement by integrating leader standard work into shift handoffs and daily standups. When operators spot safety hazards, machine micro-stops, or quality defects, they need an immediate way to record their observations directly at the source. Standardizing these inputs across shift teams establishes structured continuous improvement management system routines, ensuring every suggestion is reviewed, prioritized, and assigned a clear owner.
Real-World Case Studies: Measuring Proven Impact
Organizations across industries achieve substantial, documented gains by combining Six Sigma's analytical clarity with Kaizen's execution speed:
Automotive Component Manufacturer: A commercial vehicle parts supplier faced high inspection lead times. By conducting a targeted Kaizen event on their quality sampling cell, the team reduced inspection cycle time from 24 hours down to 7.7 hours—a two-thirds reduction. A follow-up Kaizen project focused on turning-radius verification cut measurement duration from 20 minutes to just 5 minutes, while reducing required staffing from two technicians to one.
Assembly Floor Material Logistics: A precision metal fabrication plant observed material transport delays. A cross-functional two-day Kaizen event identified unnecessary forklift movement. By moving a component staging area just twelve feet closer to the active assembly line, the facility cut forklift driver wait times by 60% within one week, requiring zero capital investment.
Public Agency Records Processing: A municipal department records division struggled with workflow handoff delays. Applying a single five-day Kaizen cycle to standardize document transfers between field personnel and administrative staff transformed a five-day backlog into same-day turnaround.
Shared Services Business Workflow: A corporate operations group reviewed administrative delays and found an approval process routed across four managerial tiers. A rapid process improvement event trimmed unnecessary handoffs down to two reviewers, cutting total cycle time in half without adding overhead.
Frequently Asked Questions about 6 Sigma Kaizen
What is the primary difference between Kaizen and Six Sigma?
Kaizen focuses on rapid, continuous, incremental improvements implemented directly by frontline operators using low-cost changes and the PDCA cycle. Six Sigma addresses complex, chronic process variation and defect reduction using structured, multi-month DMAIC phases led by certified Green or Black Belts who utilize statistical data analysis.
When should you use a Kaizen Board versus a Kanban Board?
A Kaizen Board should be used to collect, prioritize, and track continuous improvement suggestions, corrective action plans, and PDCA problem-solving cycles. A Kanban Board should be used to schedule daily production tasks, balance material consumption, limit work-in-process (WIP), and manage operational workflow across cell stages.
How is Takt Time calculated in a continuous improvement project?
Takt Time is calculated by dividing net available production time (total shift time minus scheduled breaks and planned maintenance) by total customer demand for that same period. This metric establishes the required production cadence to prevent both bottleneck starvation and excessive inventory overproduction.
What to do next: Building a Sustainable Continuous Improvement Culture
Achieving lasting operational excellence requires active leadership support and frontline ownership. When operators log issues on scrap paper or shift supervisors track actions on disconnected spreadsheets, improvement momentum stalls and team engagement drops.
To build a responsive continuous improvement culture, small to midsize manufacturers are equipping their teams with modern shop floor tools. Thrive by Lean Technologies provides a flexible digital toolbox developed by manufacturing experts specifically for small to midsize plants. Thrive digitizes frontline lean routines—enabling operators and supervisors to log issues, track corrective actions, and execute Kaizen events directly from mobile devices, tablets, or desktop stations on the floor.
Importantly, Thrive is not an ERP or MES system, and it is not designed to replace your existing ERP or MES infrastructure. Instead, Thrive organizes and drives immediate action from machine and production data entered by your team or imported from existing systems. By capturing data at the source rather than logging it hours later on clipboards, Thrive delivers clear visibility across maintenance, quality, safety, and operations.
Explore how our specialized lean six sigma software tools help frontline teams run faster Kaizen events, eliminate recurring shop floor waste, and build an active, lasting 6 sigma kaizen culture across every production line.