
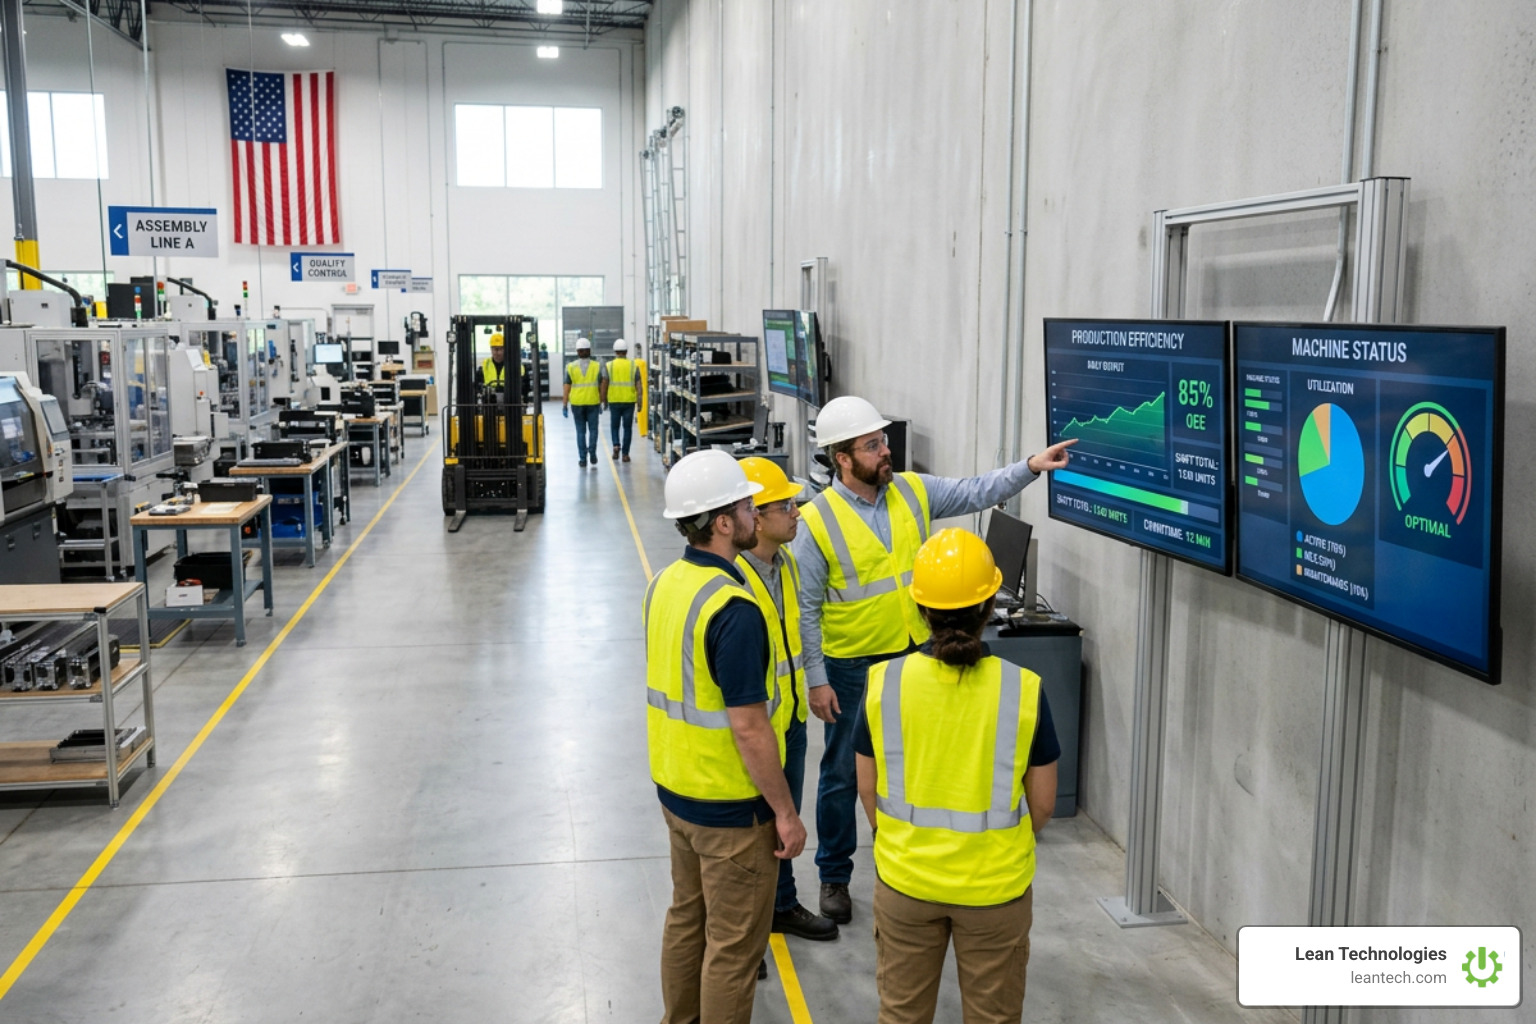
The Best Digital Visual Management Tools for Busy Managers
Your Shop Floor Deserves Better Than a Whiteboard That's Three Days Out of Date
Digital visual management is the practice of replacing physical boards, paper charts, and stale whiteboards with live, connected digital displays that show your team exactly what's happening — right now, across every level of your operation.
If you're here because your shop floor runs on a mix of sticky notes, Excel files, and whiteboards that nobody updates until the Monday morning meeting, you're in the right place.
Here's what digital visual management does, fast:
Replaces static boards with real-time digital displays of KPIs, issues, and actions
Connects every tier — from operators on the floor to plant managers in the boardroom
Tracks issues automatically so nothing falls through the cracks between shifts
Integrates with your existing tools like ERP, MES, and BI systems
Drives accountability by assigning owners and deadlines to every open item
The problem isn't that your team doesn't care about performance. It's that the systems they're using were never built for real-time decision-making.
Think about it: if your SQCDP board gets updated once a day — or once a week — it's not a management tool. It's a history lesson. By the time a supervisor reads a handwritten note about a quality deviation, the shift has moved on and the moment to act has passed.
That gap between when a problem happens and when leadership actually sees it? That's where productivity goes to die.
The good news: organizations that make the shift to digital visual management see real, measurable results. According to industry data, companies using structured digital visual management systems have achieved a 24% reduction in process variations and a 14% increase in productivity. Teams replacing paper-based data capture with smart digital tools have saved an average of 700 hours of manual work per user per year.
This guide walks through the best digital visual management tools available for manufacturing operations managers — what they do, how they work, and how to choose the right one for your plant.
What is Digital Visual Management and Why Does It Matter?
At its core, digital visual management is the evolution of Lean manufacturing's most fundamental principle: mieruka, or making things visible.
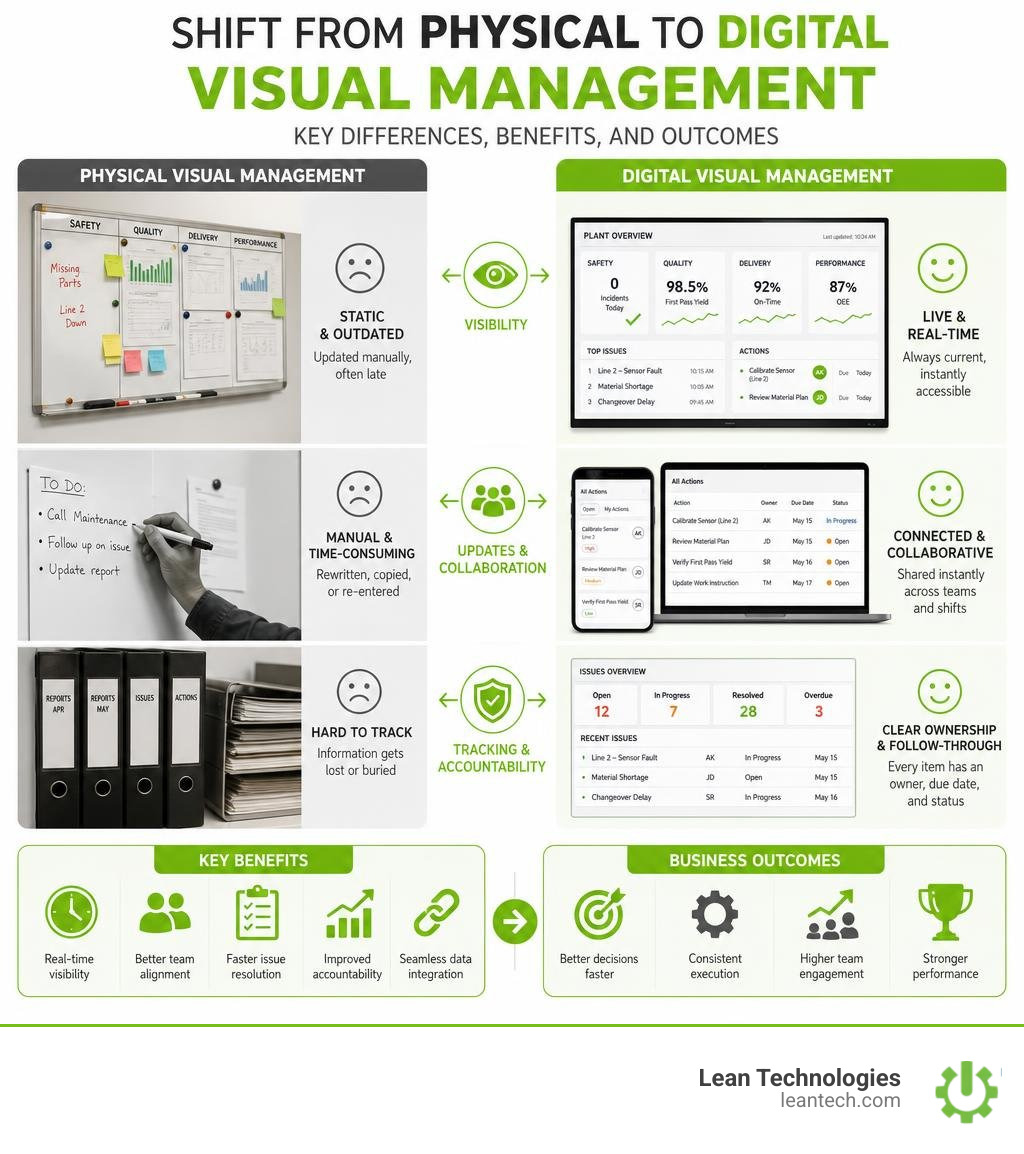
In traditional plants, visual management relies on physical boards, dry-erase markers, and paper printed-out charts. While these tools served their purpose in the 20th century, modern operations are too dispersed, and complex for paper workarounds.
When you digitize this process, you create an environment where any employee can walk up to a screen or open an app and understand the exact state of operations within three seconds. It bridges the gap between raw data and operational clarity, making it a critical foundation for Lean manufacturing, Agile at scale, and Industry 4.0 initiatives.
Without a structured digital system, massive investments in Industry 4.0 sensors and IoT platforms often result in more digital noise rather than actionable clarity. To understand why modern plants are moving away from physical tracking, consider this comparison:
Feature Physical Visual Management Digital Visual Management Data Accuracy High risk of manual entry errors, transcription lag, and lost paper sheets. Real-time updates pulled directly from the shop floor or integrated software. Accessibility Limited to the physical location of the board; impossible for remote or hybrid teams. Accessible anywhere via mobile, tablet, desktop, or plant floor wallboards. Issue Escalation Manual, relying on verbal handoffs or emails that get buried. Automatic, structured escalation across management tiers with full context. Historical Data Erased daily or weekly; hard to track long-term trends or recurring issues. Automatically saved and structured for root-cause analysis and audits. Collaboration Limited to team members standing directly in front of the board. Multi-site visibility, allowing cross-functional teams to collaborate instantly.
By moving to digital platforms, manufacturers can easily implement a Guide to Digital Lean Manufacturing that drives actual floor-level accountability. Instead of looking at historical charts of what went wrong last week, teams can view live deviations, collaborate on immediate corrective actions, and eliminate the non-value-added time spent manually updating spreadsheets.
The Organizational Connectome: Bridging Frontline and Executive Levels
An organization's management system functions much like a biological connectome — the complex map of neural connections in the brain. In a healthy manufacturing plant, information must flow seamlessly from the frontline operator up to the plant manager, and strategic directives must cascade back down.

Digital visual management serves as this exact organizational connectome. It balances two critical operational dynamics:
Top-Down Cascading: Executives and plant managers cascade strategic KPIs, safety standards, and project goals down to the shop floor.
Bottom-Up Autonomy: Frontline operators and supervisors log issues, suggest continuous improvement ideas, and flag production bottlenecks in real time.
This dual-flow architecture comes to life through structured tiered meetings (often referred to as Tier 1, Tier 2, and Tier 3 huddles):
Tier 1 (Work Cell / Shift Level): Operators start their shift standing in front of an interactive wallboard or tablet. They review safety incidents, daily production targets, and outstanding tasks. Issues that cannot be resolved within the shift are flagged for escalation.
Tier 2 (Department / Plant Floor Level): Supervisors and department managers review escalated issues from all Tier 1 cells. They coordinate maintenance, quality, and engineering resources to unblock the frontline.
Tier 3 (Plant Leadership Level): Plant managers and executives analyze plant-wide performance, review systemic issues, and track progress on capital projects.
Because the system is digital, escalation is instantaneous. When an operator logs a critical machine failure at Tier 1, it automatically populates the Tier 2 maintenance dashboard. There are no delayed emails, no missed phone calls, and no lost sticky notes. This structured rhythm is the core of modern Leader Standard Work, ensuring that leadership behaviors are directly connected to frontline realities.
Core Features of a Modern Visual System
A truly effective digital visual management platform is more than just a digital version of a whiteboard. It is an interactive command center designed to drive operational excellence and continuous improvement.
SQCDP and Kanban: The Pillars of Digital Visual Management
The absolute baseline for any manufacturing visual system is the SQCDP board. Tracking Safety, Quality, Cost, Delivery, and People ensures that every department is aligned on the metrics that matter most.
In a digital format, the traditional "Safety Cross" and performance pillars are updated live. Supervisors can log a near-miss or quality defect on their tablet during a Gemba walk, and the corresponding pillar on the central wallboard immediately turns red, triggering a defined response standard.
To manage the actions resulting from these metrics, modern platforms rely on two primary visual execution tools:
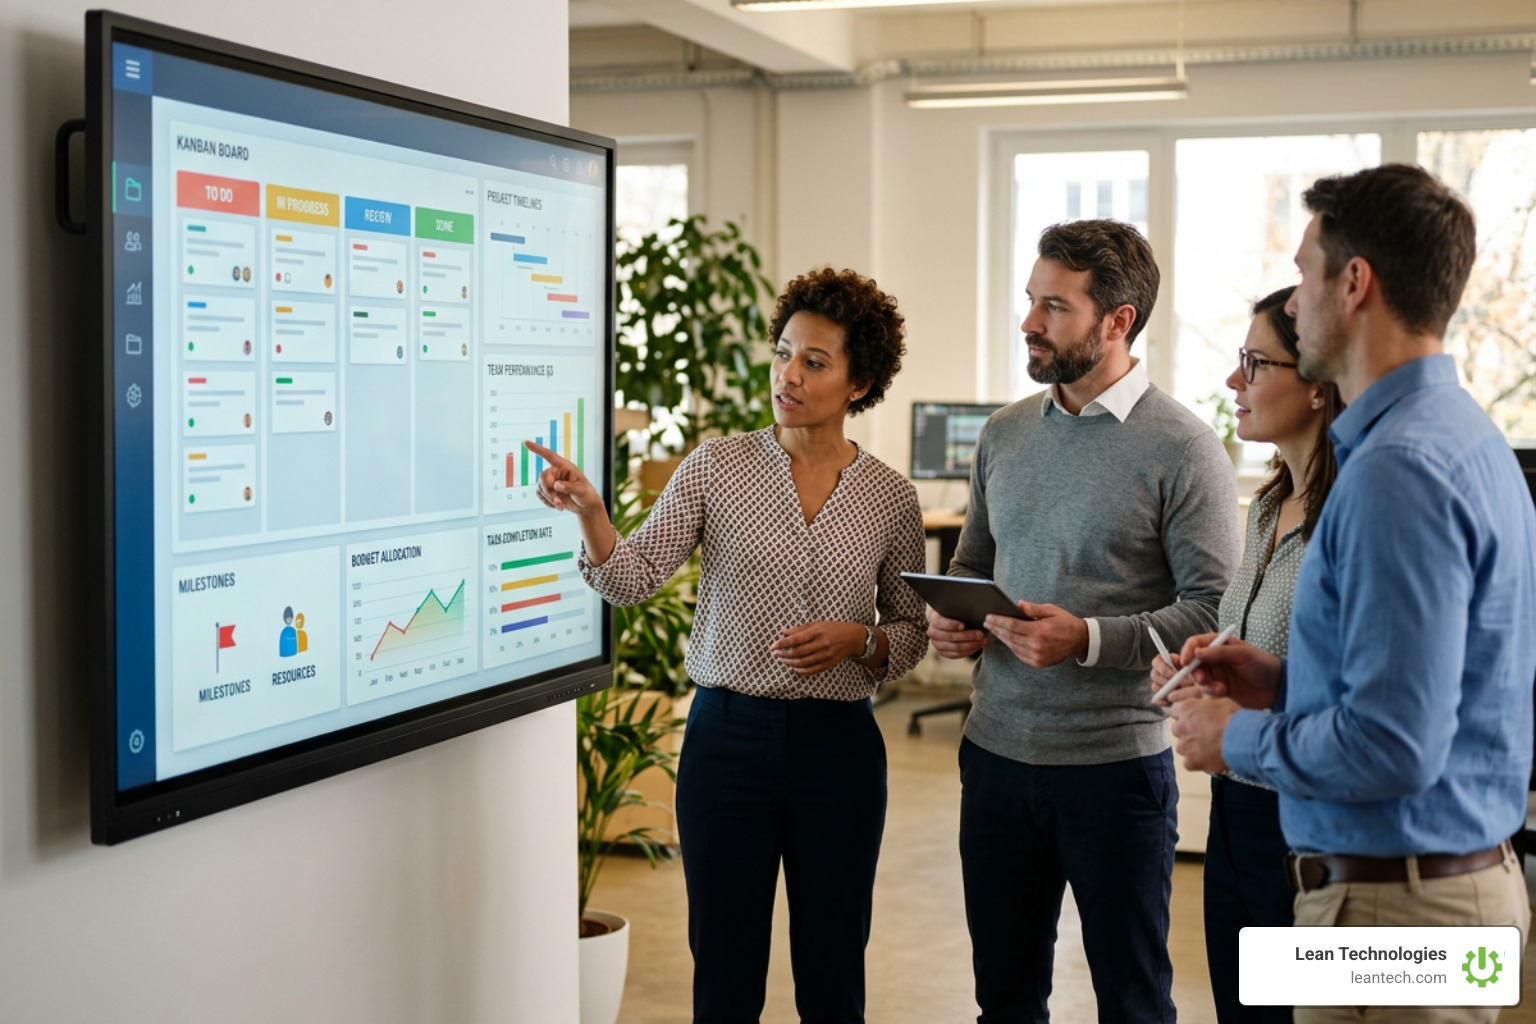
Kanban Boards: Used to manage linear, ongoing tasks. Whether tracking a maintenance work order or a continuous improvement project, a digital Kanban Board Tool allows teams to drag and drop tasks through stages like "To Do," "In Progress," and "Done," keeping work-in-progress (WIP) limited and bottlenecks visible.
Kamishibai Boards: Unlike Kanban, which tracks linear progress, Kamishibai boards are designed for cyclical audits, 5S checks, and preventative maintenance routines. They use simple, color-coded virtual cards (green for pass, red for fail) to ensure standard operating procedures are audited consistently.
These digital visual controls make it incredibly simple for teams to maintain high standards. When audits fail, they don't just sit on a paper sheet; they automatically generate a task on the Kanban board to close the loop. You can explore how these visual tools integrate into broader performance management strategies by checking out Performance Goal Boards.
Real-Time KPI Dashboards and Workflow Tracking
The real power of digitizing your visual management is the elimination of manual data manipulation. Instead of spending hours copying data from paper sheets into Excel, a connected visual system pulls live data to populate your Performance Goal Boards.
By leveraging Workflow Tracking and integrating with Business Intelligence (BI) tools like Power BI or Tableau, managers can drill down into live dashboards for rapid root-cause analysis. For example, if the "Quality" pillar on the SQCDP board is red, a manager can click directly on the metric to see which part numbers, machines, or shifts caused the deviation.
Additionally, digital shift handovers ensure that oncoming crews have full visibility into open issues, maintenance hold-ups, and safety notices from the prior shift, preventing the typical information loss that occurs during shift rotations.
How to Choose and Implement the Right Visual Tool
Choosing the right digital visual management platform can feel overwhelming with so many options on the market. To make your investment count, you need a solution that fits the reality of your shop floor.
Key Selection Criteria for Your Digital Visual Management Platform
When evaluating software, keep these four criteria at the top of your list:
Ease of Use for Operators: If your frontline operators find the software confusing, they won’t use it. Look for platforms with intuitive, touch-screen interfaces, simple forms, and mobile access so supervisors can log data directly from the floor.
No-Code Customization: Your operating model is unique. Avoid rigid platforms that force you into pre-built templates. Choose a no-code platform that allows you to easily configure your digital boards, KPI pillars, and escalation rules to match your existing standards.
Integration Capabilities: Your visual boards shouldn't be data silos. They need to connect seamlessly with your existing ERP, MES, or computerized maintenance management systems (CMMS) via modern APIs to ensure data flows in real time.
Actionable Continuous Improvement: A great tool doesn't just display data; it drives action. Platforms like Thrive CI help teams capture frontline ideas, assign corrective actions, and track continuous improvement projects through to completion.
Driving Cultural Change and Successful Adoption
Software is only as good as the culture that supports it. To ensure successful adoption, you must treat the transition from paper to digital as a cultural change, not just an IT project.
Conduct Digital Gemba Walks: Supervisors and managers must use the digital boards as their primary tool during Gemba walks. When leaders actively review and update the system on the floor, it signals to the entire team that the data matters.
Standardize the Rituals: Build your daily huddles and tier meetings directly around the digital dashboards. If the team sees that the boards are the central source of truth for every operational decision, updating them will quickly become a natural part of their daily routine.
Focus on Problem Solving, Not Blame: Use the visibility provided by the system to identify process issues, not to punish individuals. When an operator flags a failure on a Kamishibai card or logs a downtime event, celebrate the transparency and focus on solving the root cause.
By embedding these practices into your standard work, you create a self-sustaining continuous improvement culture where every employee feels empowered to contribute to operational excellence. Learn more about empowering your frontline teams with Thrive CI.
Frequently Asked Questions about Operational Visuals
How does digital visual management improve on traditional whiteboards?
Traditional whiteboards go stale the moment a meeting ends. They can't be viewed by anyone off the shop floor, they have no historical record, and they require manual updates that waste valuable supervisor time. Digital boards stay current with live data, automate issue escalation, provide cross-site visibility for multi-plant benchmarking, and preserve data history for continuous improvement analysis.
Can we integrate digital visual management with our existing ERP or MES?
Yes. Modern digital visual systems are designed to sit on top of your existing IT infrastructure. Through secure APIs, they can pull live production data, inventory levels, and maintenance schedules directly from platforms like SAP, Microsoft 365, or local MES databases, eliminating data silos and manual double-entry.
How long does it take to deploy a digital visual management system?
While legacy enterprise software can take months or years to implement, modern no-code digital visual management platforms can be configured and deployed in a matter of weeks. Because these platforms adapt to your existing meeting structures and standards, frontline teams can adopt them rapidly, often showing positive ROI in under four months.
In Summary: Stop Managing Your Shop Floor Through Spreadsheets
Managing a modern manufacturing plant using paper, spreadsheets, and whiteboard markers is a recipe for operational delay, communication breakdowns, and missed targets.
If you want real-time visibility, faster problem-solving, and a highly accountable shop floor culture, it is time to upgrade to a dedicated digital visual management system.
That is where Thrive by Lean Technologies comes in.
Developed by manufacturing experts who understand the daily realities of the shop floor, Thrive is an all-in-one, highly customizable software designed to streamline your operations, boost productivity, and improve profitability. Unlike rigid MES or ERP systems, Thrive acts as a flexible, digital toolbox that fits seamlessly into your team's existing workflows. It gives your operators, supervisors, and plant managers the real-time visibility they need to log issues, track actions, and sustain continuous improvement.
Stop managing your shop floor through spreadsheets and wishful thinking. Let your team run lean, drive frontline accountability, and gain true visibility from the frontline to the boardroom.
Discover how Thrive can transform your operations by exploring Thrive CI and take the first step toward a more connected, visual, and efficient shop floor.
To explore more of our solutions, visit our main site at Lean Technologies or check out our specialized modules for maintenance and safety management.