
What Is Production Efficiency and How Do You Track It Accurately?
Measure Production Efficiency Before Small Losses Become Big Problems
Measuring production efficiency starts with one simple comparison: actual good output versus the output your people, machines, and materials should produce under the same conditions. Track it by line, shift, product, and constraint. Then review the losses behind the gap: downtime, slow cycles, scrap, rework, and waiting.
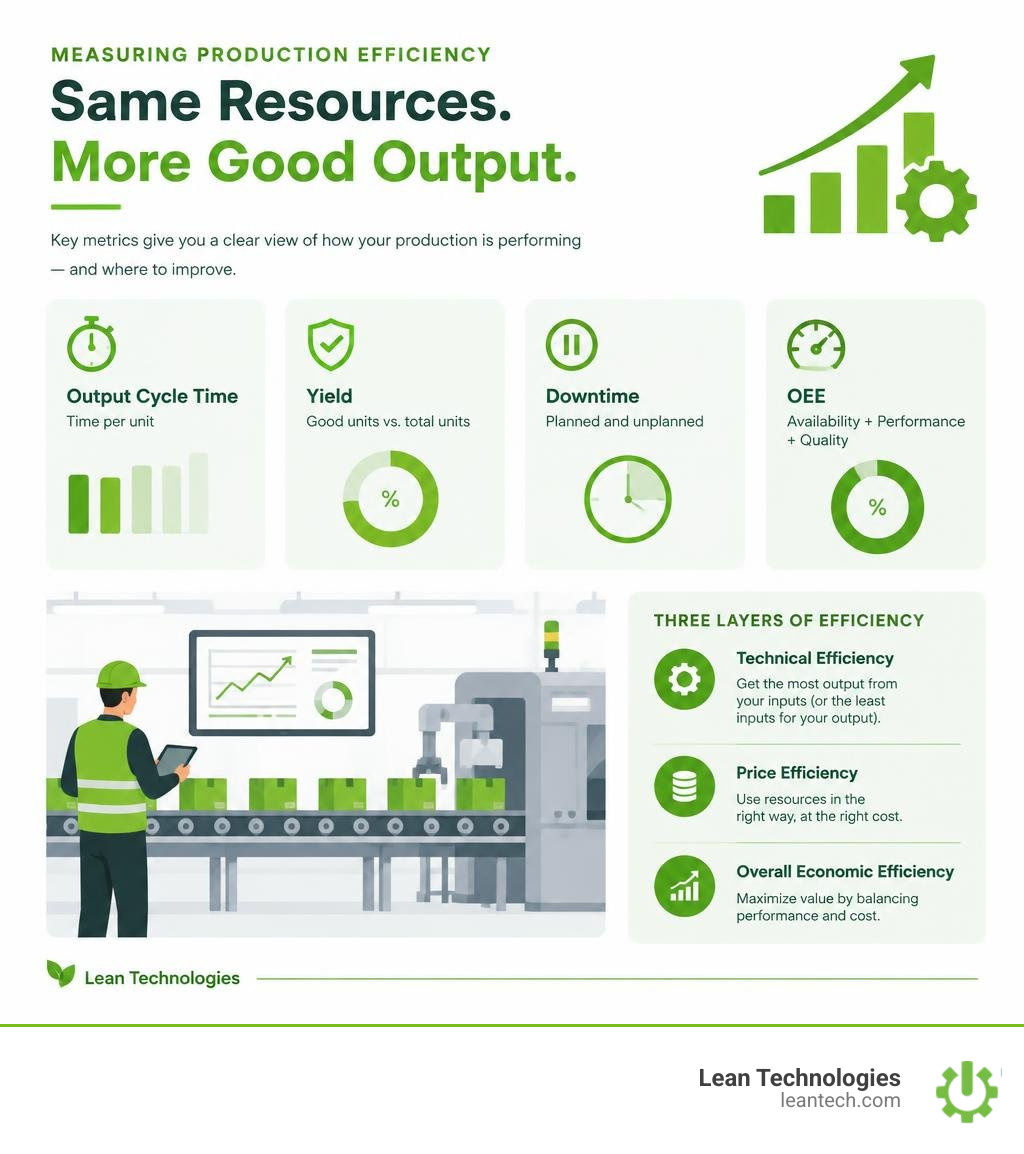
A practical starting set of metrics is:
Throughput: Good units completed per hour or shift.
Cycle time: Actual time per unit compared with the standard time.
Yield and scrap: The share of units that pass quality without rework.
OEE: Availability, performance, and quality combined for critical equipment.
For an operations manager, the challenge is rarely a lack of numbers. It is that production data lives in paper logs, separate spreadsheets, and end-of-shift reports. By the time a trend is visible, the shift is over and the same loss may have happened again.
Production efficiency is not the same as running equipment faster. It means converting available labor, materials, machine time, and energy into the greatest feasible amount of good output, without adding avoidable waste. Consistent definitions and point-of-source data entry give supervisors a timely view of what changed, where it changed, and who needs to act.
Thrive is a flexible digital toolbox for small to midsize manufacturers. It helps teams digitize lean work, log issues, track actions, and follow through on continuous improvement. It is not an ERP or MES, and it does not replace those systems. When teams enter machine and production data at the source - or import it from existing systems - Thrive organizes that information into visible, actionable work instead of leaving it in paper forms and disconnected files.
Understanding Technical, Price, and Overall Efficiency in Manufacturing
To run a tight operation, plant managers and continuous improvement leaders need to separate physical performance from market-driven economics. When evaluating a production line, we look at three distinct layers of performance: technical efficiency, price (allocative) efficiency, and overall economic efficiency.
Technical Efficiency: This measures the purely physical relationship between inputs (machine hours, labor hours, raw materials) and outputs (finished, quality goods). A work center is technically efficient if it produces the maximum possible output from a given set of inputs, or conversely, uses the minimum possible inputs to produce a targeted output.
Price (Allocative) Efficiency: This reflects whether the plant is using inputs in the right proportions given their relative market prices. A process might run flawlessly in terms of physical machine utilization, but if it relies heavily on expensive overtime labor instead of balanced shift scheduling, it suffers from allocative inefficiency.
Overall Economic Efficiency: This is the product of technical and allocative efficiency. Achieving overall efficiency means producing the maximum possible revenue-generating output at the absolute lowest cost.
Efficiency Type | Core Focus | Key Question Answered | Primary Measurement Target |
|---|---|---|---|
Technical Efficiency | Physical conversion | Are we maximizing physical output from our machines, labor, and materials without waste? | Machine runtime, scrap rates, cycle times, labor hours |
Allocative Efficiency | Cost ratio optimization | Are we combining our input resources in the most cost-effective proportions given current prices? | Overtime costs, material mix costs, tooling expenses |
Overall Efficiency | Total economic performance | Is the operation maximizing net profit by eliminating physical waste and cost imbalances simultaneously? | Total cost per good unit produced, gross operational margin |
Classic economic models of technical efficiency emphasize that isolating physical waste from pricing noise is essential for operations. When raw material prices surge or energy rates fluctuate, your shop floor supervisors cannot control the market. However, they can control scrap, changeover delays, and machine speeds. Evaluating technical performance separately prevents market shifts from masking real shop-floor improvements.
The Role of Efficient Isoquants and Production Frontiers
In production economics, an efficient isoquant represents the boundary of maximum feasible output that can be achieved from different combinations of physical inputs. Established in foundational research by M.J. Farrell and expanded through Shephard’s duality theory, the production frontier models the best-practice boundary across comparable operations.
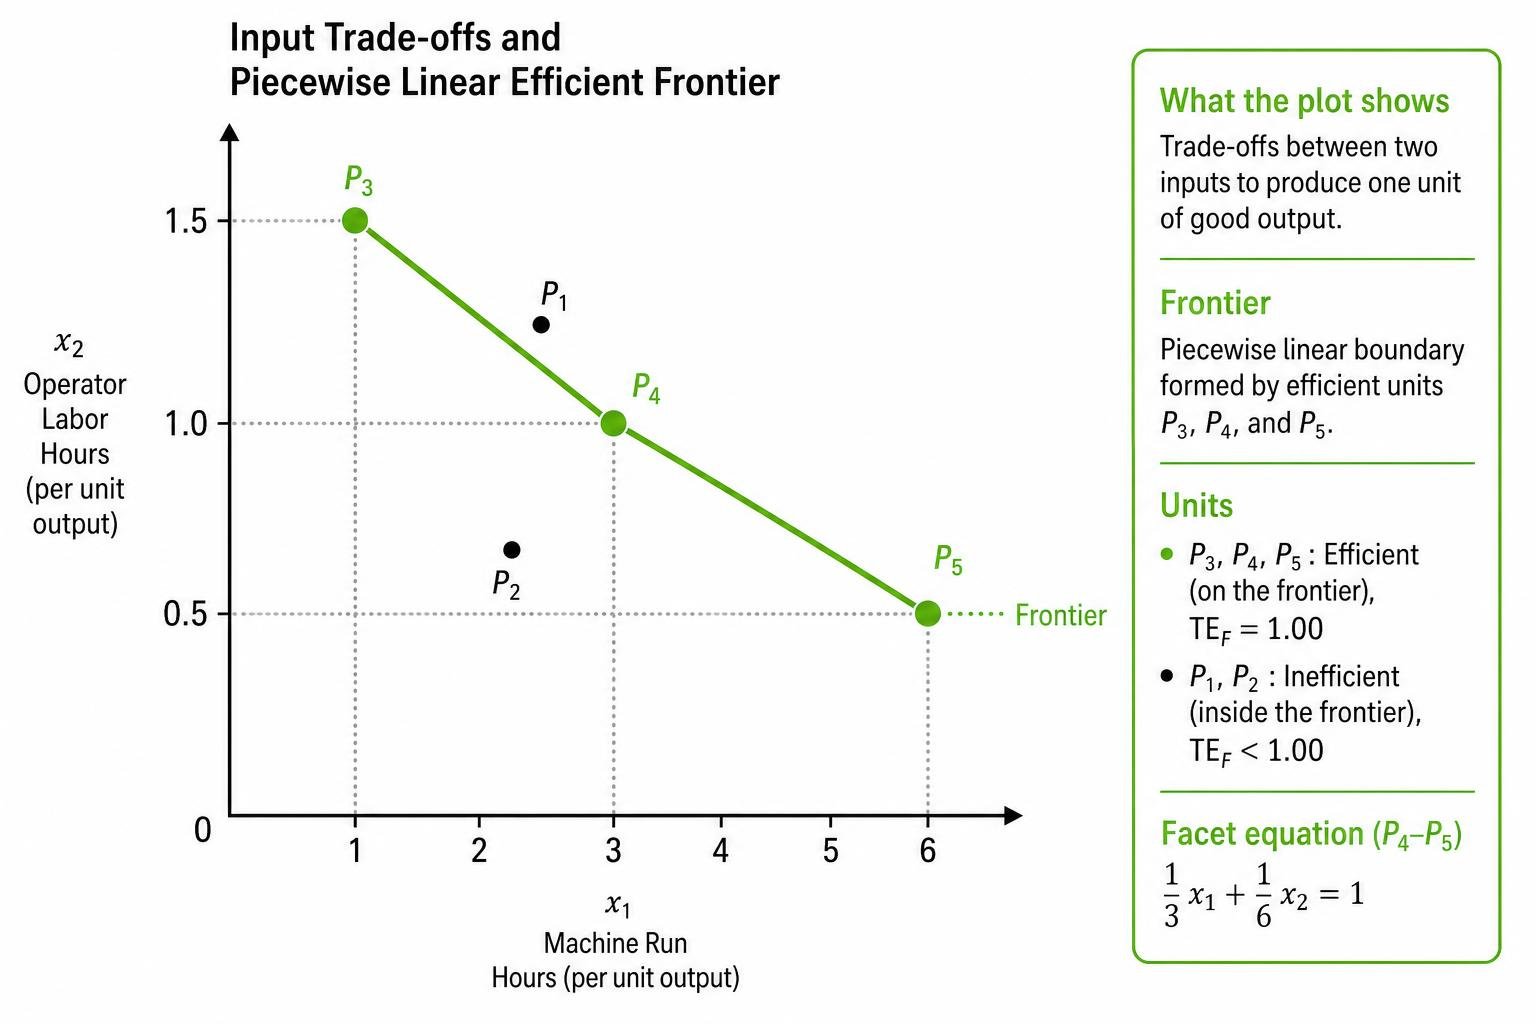
In empirical analysis, the efficient frontier is constructed as a piecewise linear boundary connecting the most efficient operating units (often referred to as extreme points).
Consider an evaluation of five manufacturing lines or peer plants labeled P1 through P5 producing standardized parts with two primary inputs: machine run hours and operator labor hours, normalized per unit of output:
Efficient Benchmark Units: Units P3, P4, and P5 operate directly on the frontier, yielding a Farrell Technical Efficiency Score of 1.00. The facet connecting P4 and P5 forms a piecewise linear boundary where one-third of a machine hour plus one-sixth of a labor hour equals one unit of output.
Inefficient Units: Units P1 and P2 fall outside this frontier. When calculating the performance of P2, linear programming yields an optimal scale parameter of 7/6. The efficiency measure is the reciprocal, which works out to 6/7, or about 0.857.
This result means that unit P2 could achieve its exact current output using only about 85.7% of its current inputs if it matched the operational standards set by the frontier units.
Reviewing research on frontier production functions and technical efficiency confirms that non-parametric frontiers provide realistic targets because they compare plants directly to observed best performances rather than theoretical ideals.
Core Methodologies for Measuring Production Efficiency in Modern Plants
Modern plants benchmark line performance using two primary analytical approaches: parametric models and non-parametric models. Understanding both helps engineering and operations teams select the right tools to optimize manufacturing efficiency.
Parametric Approaches (e.g., Stochastic Frontier Analysis - SFA): SFA uses statistical regressions to construct a smooth production frontier. Its main strength is that it models measurement noise and random mechanical anomalies separately from genuine operational inefficiency.
Non-Parametric Approaches (e.g., Data Envelopment Analysis - DEA): DEA uses linear programming to envelop observed input and output data without assuming a rigid mathematical production formula. It is widely used when evaluating multi-machine cells that handle complex, mixed-model assemblies.
Quantitative Frameworks for Measuring Production Efficiency Across Lines
Linear programming (LP) provides a practical framework for measuring production efficiency across plants, work centers, and product lines without requiring price data. By evaluating each line as an independent Decision-Making Unit (DMU), plant leadership can uncover hidden capacity.
Applying fractional programming allows managers to solve for an optimal efficiency ratio. The calculation divides the weighted sum of outputs by the weighted sum of inputs for each line. The weights are calculated coefficients that must be greater than zero, ensuring every input and output receives at least minimal consideration in the efficiency score.
Through linear transformations, this fractional problem is converted into standard LP duals. The dual formulation assigns shadow prices or optimal weights to inputs and outputs. For instance, along the efficient facet connecting benchmark units P4 and P5, the dual program identifies optimal weights of one-third for machine hours and one-sixth for labor hours.
These weights represent the marginal rates of technical substitution between inputs, revealing how much labor reduction is needed to offset machine downtime along the frontier. As outlined in foundational research on measuring efficiency of decision-making units, these LP duals allow operations teams to systematically project inefficient units directly onto the best-practice isoquant.
Essential Shop Floor KPIs: OEE, Throughput, and Cycle Time
While econometric modeling helps with high-level benchmarking, daily plant management relies on practical, time-tested shop floor indicators.
Overall Equipment Effectiveness (OEE): The gold standard for measuring equipment effectiveness. It combines Availability (operating time vs planned production time), Performance (actual operating speed vs design cycle speed), and Quality (good parts produced vs total parts run). Teams often implement dedicated OEE tracking software to maintain consistent loss categorization across shifts.
Throughput: The volume of finished, acceptable product moving through the bottleneck over a specific timeframe (e.g., units per operating hour). Production leaders use specialized methods for improving factory throughput by focusing continuous improvement efforts directly on constraint operations.
Standard vs. Actual Cycle Time: The elapsed time between consecutive parts coming off a workstation compared against the engineering baseline.
Scrap and First-Pass Yield: The percentage of material and assemblies that clear inspection without requiring off-line rework.
Step-by-Step Guide: How to Track and Calculate Plant Efficiency Accurately
Transitioning from disconnected spreadsheets to a reliable efficiency tracking process requires clear definitions and standard practices.

Follow this four-step sequence to establish an accurate efficiency tracking routine:
Step 1: Establish Standardized Inputs and Expected Outputs
Define the nameplate capacity and engineering cycle times for every part number across each machine cell. Account for non-discretionary variables (such as mandated tool cooldowns or regulatory sanitation cycles) so your expected output rate reflects real operating constraints rather than theoretical lab conditions. Deploying specialized production efficiency software helps maintain these baselines in one central registry.
Step 2: Implement Point-of-Source Operational Data Capture
Replace end-of-shift paper logs with direct data entry at the workstation using mobile devices, tablets, or desktop terminals. When operators log work order completions, scrap counts, and downtime reasons directly at the source, your numbers remain accurate and free from shift-end guesswork. Align your processes with modern real-time production monitoring strategies to ensure leadership reviews genuine operating conditions.
Step 3: Calculate Actual vs. Standard Output Rates
Use the classic production efficiency equation at regular intervals throughout the shift. Divide the actual good units produced by the standard expected output, then multiply by 100 to express the result as a percentage. The standard expected output equals the operating time multiplied by the standard run rate per hour.
Step 4: Visualize Daily Trends and Address Bottlenecks
Organize shift logs into clear visual boards that highlight deviations as they occur. Utilizing proven manufacturing data visualization dashboards allows supervisors to spot recurring minor stops before they turn into full line shutdowns. Pair these visual boards with actionable manufacturing analytics to review root causes during daily tiered stand-ups. For a broader overview of modern data architectures, consult our 2026 real-time data software strategies.
Practical Challenges and Best Practices for Continuous Improvement
Setting up metrics is only half the battle. Maintaining clean data and building operator engagement requires steady operational discipline.
Eliminate Disconnected Spreadsheets and Paper Workarounds: Paper travel sheets and localized desktop spreadsheets create data silos. When maintenance logs live in one binder and quality rejections in another, finding the root cause of an efficiency loss takes days.
Foster Cross-Shift Accountability: Standardize downtime reason codes across all operating crews. If Shift 1 logs an issue as "mechanical breakdown" while Shift 2 logs the same issue as "operator adjustment," your maintenance team cannot prioritize recurring problems effectively.
Focus on Actionable Micro-Kaizens: Highlighting an efficiency gap should trigger action, not blame. Pair line performance tracking with structured continuous improvement tasks to fix root causes permanently. Review our collection of proven best practices to improve manufacturing efficiency for practical continuous improvement playbooks.
Overcoming Operational Pitfalls When Measuring Production Efficiency on the Shop Floor
A common stumbling block in efficiency measurement is confusing planned targets with actual shop-floor outcomes. As detailed in academic literature on measuring efficiency under uncertainty, operations teams make ex ante planning decisions based on standard run rates, but they record ex post actual output after dealing with real-world variability—such as raw material inconsistencies or unexpected micro-stops.
When efficiency drops, avoid the reflex of simply speeding up machine cycles. Pushing machines beyond their rated capability often introduces thermal stress, increases scrap, and creates bottleneck pileups downstream. Focus instead on uncovering the operational friction behind the loss—such as slow changeovers, material shortages, or delayed maintenance support.
Frequently Asked Questions About Production Efficiency
What is the primary formula used for measuring production efficiency?
Production efficiency is calculated by dividing the actual volume of good output produced by the standard expected output for that run time, then multiplying by 100 to get a percentage. For example, if a line is scheduled to produce 500 parts per hour under standard cycle times and yields 425 good parts in an hour, its production efficiency is 425 divided by 500, times 100, which equals 85%.
How does technical efficiency differ from allocative efficiency?
Technical efficiency focuses purely on physical waste—evaluating whether an operation is extracting the maximum possible good product from the equipment, labor, and materials supplied. Allocative efficiency evaluates whether those inputs are combined in the most cost-effective ratio based on their market purchase prices.
Why are traditional paper logs ineffective for tracking efficiency?
Paper logs are vulnerable to missing entries, transcription mistakes, and shift-end guesswork. Because paper data remains locked on clipboards until someone manually enters it into a spreadsheet, supervisors miss the window to fix issues during the shift. Point-of-source digital entry provides immediate visibility and creates a shared, reliable record for maintenance, quality, and production teams.
In Summary
Accurate efficiency tracking is the backbone of a resilient, waste-free manufacturing operation. When teams consistently compare actual good output against clear engineering standards, they protect margins, boost capacity, and build an active culture of continuous improvement.
Thrive supports this process by giving small to midsize manufacturers a flexible digital toolbox. By replacing paper sheets with structured, point-of-source data entry on mobile devices, tablets, and desktops, Thrive helps teams log issues, assign corrective maintenance, and track continuous improvement actions in one central workspace. For a comprehensive walkthrough on digitizing your continuous improvement workflows, explore our practical guide to digital lean manufacturing.