
A Practical Guide to Compare Real-Time Data Tools
Monitor Shop Floor Performance With Real-Time Data
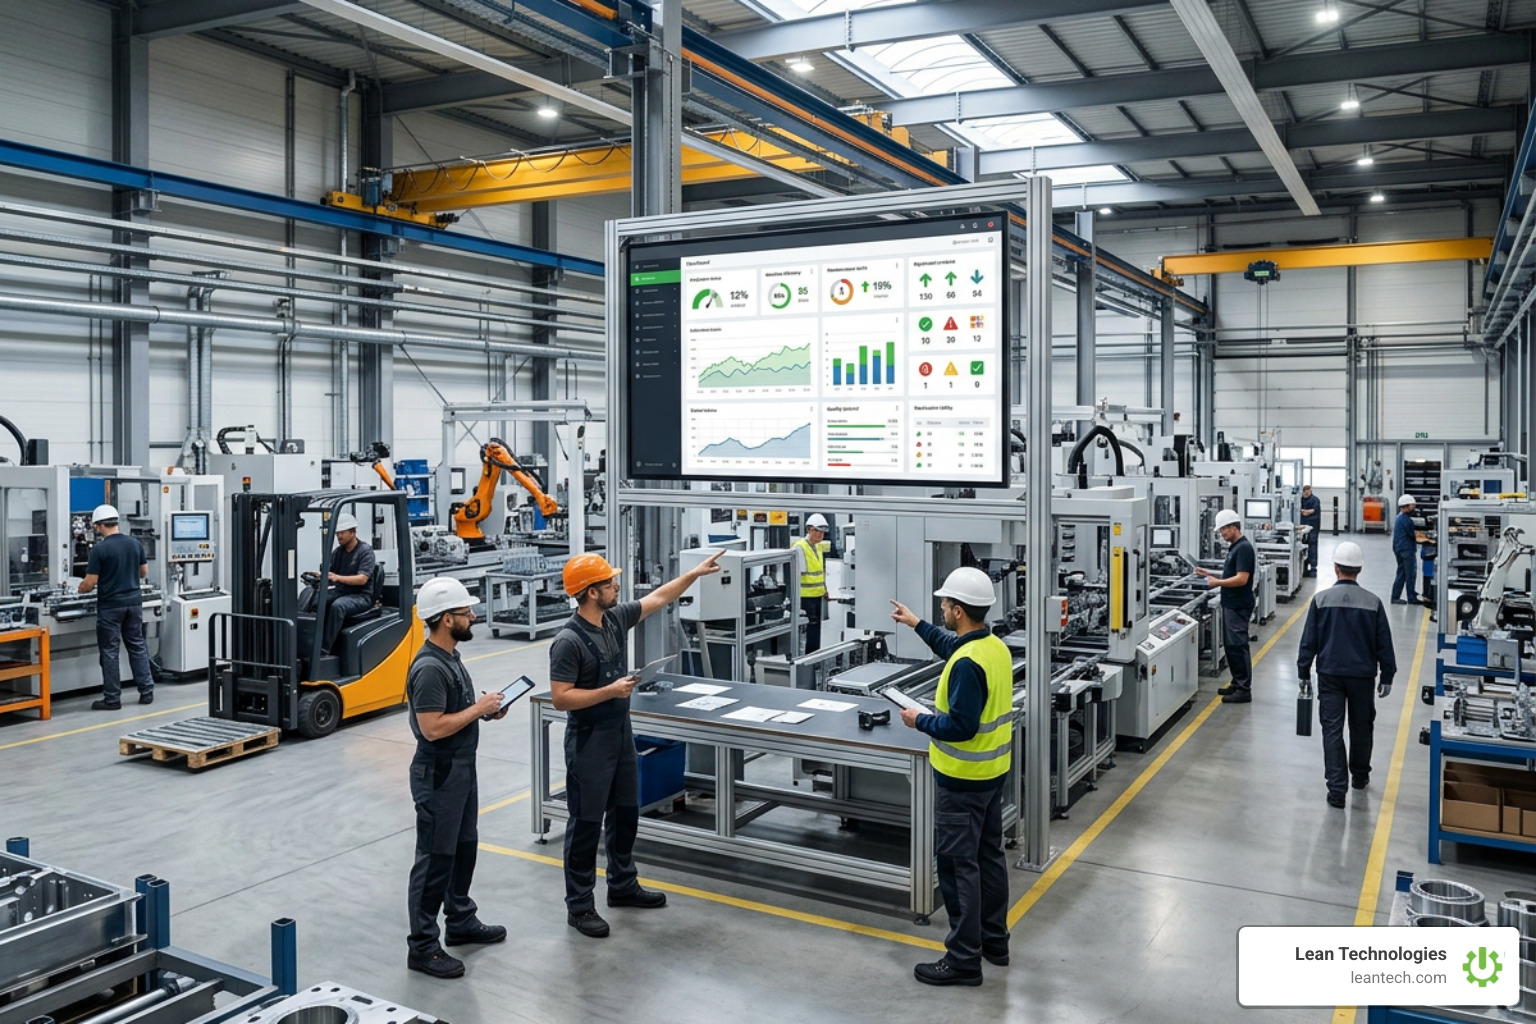
When production data lives in paper notes, spreadsheets, and delayed reports, problems can last an entire shift before anyone sees them. Real time data software helps you monitor operational performance as work happens - but start by matching the tool to the decision you need to make.
Define the few metrics that need fast action, such as downtime, quality issues, open corrective actions, or missed checks.
Set a practical freshness target. A line-stop issue may need visibility in minutes; a weekly trend does not.
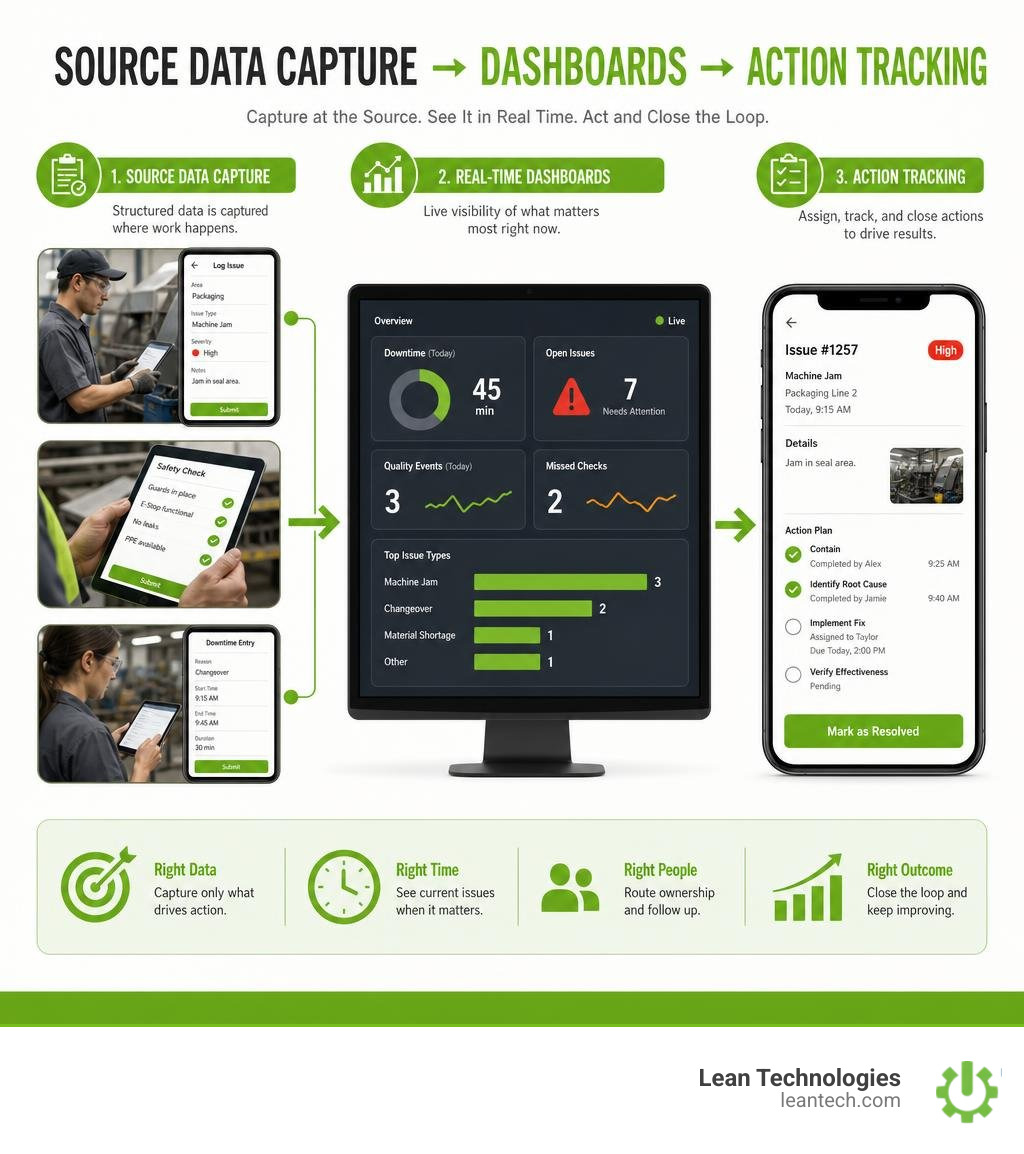
Capture structured data where work occurs, then show it in a shared dashboard and route ownership for follow-up.
Real-time does not always mean sub-second. For most plant teams, it means the right people can see a current issue, understand its status, and act before it becomes scrap, missed output, or a difficult shift handoff.
Thrive is a digital platform built for small to midsize manufacturers to digitize lean work processes in real time without replacing ERP or MES systems. It is a flexible digital toolbox for logging issues, tracking actions, and driving continuous improvement - not an ERP or MES. Thrive provides real-time visibility when processes are structured and data is entered at the source through mobile, tablet, or desktop. It does not collect sensor data or run predictive alerts; instead, it organizes action around machine data entered by teams or imported from other systems.
This guide will help you compare real-time data tools based on the data you have, the speed your operation truly needs, and the workflows that turn visibility into improvement.
Core Architecture: How Real-Time Data Systems Operate
To evaluate streaming technology effectively, we must first examine how modern event platforms process telemetry under the hood. Traditional enterprise stacks run on scheduled intervals, querying transactional relational databases during off-peak hours. In contrast, modern real-time architectures process data continuously as events occur, eliminating batch-induced blind spots.
Understanding real-time data platform components requires breaking the pipeline down into four operational tiers:
Continuous Ingestion Layer: Ingests event streams, system logs, change data capture (CDC) feeds, and operator inputs into message queues.
Stream Processing & Transformation: Computes moving averages, evaluates windowed logic, deduplicates records, and cleans raw streams in-flight.
Real-Time Analytical Storage: Stores high-throughput structured data using columnar layouts, memory-mapping, or in-memory caches to serve concurrent queries in milliseconds.
Actionable Visualization & Routing: Translates data streams into visual dashboards, mobile alerts, automated work orders, and trigger-based notifications.

Stream Ingestion and Message Brokers
At the core of high-throughput data pipelines sits the event broker. Modern stream ingestion engines decouple data producers from consumers, buffering high-frequency inputs so downstream platforms never drop records during traffic spikes.
Modern event streaming solutions have evolved beyond legacy JVM-based architectures. By leveraging native C++ thread-per-core designs and Raft-based consensus protocols, platforms like data-streaming engines eliminate ZooKeeper coordination dependencies and garbage collection pauses. These architectures deliver up to 10x lower tail latencies than traditional message brokers while writing streaming records directly to resilient object storage.
When evaluating ingestion layers, look at connection flexibility. Production environments require direct support for database CDC, webhooks, and pub/sub message brokers like hstreamdb/hstream to ingest events seamlessly across distributed environments.
Stream Processing vs. Traditional Batch Processing
The fundamental difference between streaming engines and traditional data warehouses lies in processing triggers. Batch engines accumulate raw records in disk-based tables and execute heavy queries at fixed intervals. Streaming platforms evaluate logic incrementally as each packet arrives.
As highlighted in technical discussions around real-time analytics architecture, stream processing platforms rely on distinct windowing strategies:
Tumbling Windows: Non-overlapping, continuous time blocks (such as a fixed 5-minute scrap aggregation) that summarize metrics in distinct buckets.
Hopping (Sliding) Windows: Overlapping time frames (such as computing a moving 10-minute average machine temperature evaluated every 30 seconds).
Session Windows: Dynamic time gaps that group activity based on periods of active operational events, closing out when a threshold of inactivity is reached.
By utilizing incremental materialized views, real-time engines compute windowed metrics on the fly. This prevents analytics databases from recalculating billions of historical records just to surface current plant or application performance.
Evaluating Real Time Data Software for Operational Performance
Selecting the right real-time infrastructure depends on understanding the latency tiers and architectural footprints of different software categories. A high-frequency algorithmic trading desk has drastically different infrastructure requirements than a plant supervisor tracking equipment downtime.

The market for real-time tooling broadly divides into three technical categories:
Tool Category Primary Architecture Benchmark Latency Ideal Use Cases Streaming SQL Engines Lightweight C++ single binaries, SIMD vectorization 1 ms – 50 ms In-flight telemetry transformation, metric filtering, CDC stream processing In-Memory Platforms & Caches In-RAM key-value indexing, vector memory mapping Sub-millisecond (<1 ms) High-speed transaction caching, AI agent memory, sub-second feature stores Real-Time Analytical Databases Columnar storage, decoupled compute-storage 10 ms – 500 ms Interactive BI dashboards, high-cardinality multi-table joins, historical analytics
Streaming SQL Engines vs. In-Memory Data Platforms
For ultra-low latency compute, specialized systems push hardware efficiency to the limit. For example, unified streaming engines like timeplus-io/proton compile the entire processing and analytical pipeline into a single C++ binary under 500MB without external JVM dependencies. In performance benchmarks, these engines can achieve up to 90 million events per second (EPS) with 4 millisecond end-to-end latency and handle high-cardinality aggregations exceeding 1 million unique keys on standard commodity workstations.
Meanwhile, in-memory platforms like kdb+ | KX use vector-oriented array processing and memory mapping (mmap) to keep the core binary footprint small enough to reside in CPU L1/L2 cache. This eliminates memory bus bottlenecks, allowing capital market applications and telemetry engines to evaluate millions of data ticks per second with sub-millisecond execution.
Selection Criteria for Modern Real Time Data Software
When comparing real-time platforms across the market (as outlined in reviews on top tools for real-time data analytics), consider these core criteria:
Tail Latency (p99 Metrics): Avoid evaluating tools purely on median (p50) speeds. High tail latency creates unpredictable performance bottlenecks during peak operational hours.
Hardware and Resource Footprint: Evaluate whether the engine requires complex distributed clusters or runs efficiently as a single binary on minimal compute.
Zero-ETL and Lakehouse Integration: Modern analytical databases like Apache Doris: Open Source, Real-Time Analytics and Search Database for the AI Era - Apache Doris query open lakehouse formats (like Apache Iceberg and Delta Lake) directly in place, preventing redundant data duplication.
Connector Ecosystem: Ensure the tool natively supports your existing message brokers, SQL dialects, and transactional databases without requiring custom middleware scripts.
Operational Usability: High-powered databases solve storage and compute, but physical operations require platforms that connect structured inputs directly to frontline action, as highlighted in our guide to digital lean manufacturing.
How Real Time Data Software Powers AI Context and Automation
Modern enterprise automation relies heavily on fresh contextual data. Approximately 80% of enterprise AI projects stall without real-time context, because large language models and autonomous agents suffer from contextual drift and hallucinations when fed stale records.
In modern agent stacks:
In-memory data stores provide shared short-term and long-term agent memory across complex interactions.
Real-time semantic caching cuts LLM response latencies by 4x and lowers external API token costs by up to 70%.
In-memory vector search allows autonomous agents to query live machine state, open work records, and standard operating procedures instantly.
By streaming live event data directly into operational AI tools, systems can automatically flag threshold violations, summarize shift handoffs, and draft corrective action items without human intervention.
Step-by-Step Framework to Monitor Operational Performance in Real Time
Building an effective operational monitoring system requires more than installing a high-throughput database. If your frontline personnel do not enter accurate data or if your dashboards do not assign clear accountability, real-time charts become expensive wall decorations.
Deploying a complete real-time operational loop involves three clear steps:

Connecting operational data to plant floor execution bridges the gap between infrastructure software and a Post/Manufacturing Operations Management Platform.
Step 1: Map Data Sources and Define Latency Requirements
Avoid the common pitfall of treating all operational data identically. Group your plant and operational metrics into practical latency budgets:
Sub-Second Latency (Machine Control & Network Safety): Automated interlocks, power distribution grids, and high-frequency sensor loops.
Second-to-Minute Latency (Operational Bottlenecks & Quality): Line stoppages, scrap events, open maintenance calls, and assembly line takt times.
Shift-Level Latency (Continuous Improvement & Planning): Overall equipment effectiveness (OEE), preventive maintenance completion rates, and root-cause action loops.
Auditing your actual velocity needs prevents over-engineering expensive streaming pipelines for metrics that teams only review during daily standup meetings.
Step 2: Establish Source-Level Data Capture and Workflows
Real-time visibility is impossible when data is trapped on paper forms, buried in personal clipboards, or logged hours after an event. The single biggest barrier to operational monitoring is late or missing data entry.

Thrive serves as the fastest path to structured, accountable work processes. By digitizing lean routines directly at the machine or workstation:
Operators record downtime causes, quality defects, and scrap counts directly on mobile devices, tablets, or desktop terminals.
Frontline teams execute standard digital checklists for autonomous maintenance and 5S audits.
Supervisors track work status in real time through structured workflow tracking and manage equipment health via equipment asset tracking.
When operators log issues at the source, shopfloor visibility updates instantly, eliminating the end-of-shift scramble to reconstruct operational events.
Step 3: Implement Visual Dashboards and Action-Triggering Workflows
Capturing clean, structured data allows you to automate plant floor reactions. Visual dashboards must immediately route ownership to prevent operational lag.
Centralize Live KPI Dashboards: Display open bottlenecks, active downtime tickets, and safety observations across shared plant monitors.
Trigger Immediate Escalations: When an operator logs an uncontained defect or unexpected stoppage, route an automated alert to the designated area supervisor or technician.
Coordinate Maintenance Execution: Link recurring machine issues directly to planned maintenance routines and verify work order history to determine if a failure pattern is repeating.
Close the Continuous Improvement Loop: Convert persistent downtime reasons into structured problem-solving tasks, ensuring issues are addressed systematically rather than patched repeatedly.
Common Implementation Challenges and Best Practices
Scaling real-time architectures presents specific technical and cultural hurdles. Whether managing high-throughput cloud infrastructure or rolling out digital tools across multiple manufacturing facilities, teams must address these core challenges.
Managing Infrastructure Costs and Scalability
High-velocity data streams can quickly generate massive cloud networking, compute, and storage bills if left unoptimized.
To keep operational data infrastructure cost-effective:
Filter at the Ingestion Source: Consuming an unfiltered firehose floods downstream databases with noise. Platforms like Real-Time Blockchain Data Streaming | Allium demonstrate that applying source-level filtering and schema transformations can reduce downstream event volume by over 90%.
Adopt Follower Fetching: In distributed cloud clusters, configure consumers to read from local availability zone replicas (follower fetching), cutting cross-AZ data transfer fees by up to 80%.
Implement Tiered Storage Lifecycle: Keep active working datasets in RAM or local NVMe storage, while automatically archiving warm and cold historical data to object storage tiers.
Bypass Broker Intermediaries Where Possible: Use cloud-native streaming architectures that write directly to compressed object storage, reducing cross-AZ infrastructure overhead by up to 90%.
Ensuring Data Accuracy, Security, and Governance
A real-time dashboard displaying bad data only helps teams make bad decisions faster. Maintaining data integrity across continuous streams requires strict governance rules:
Automated Schema Enforcement: Validate incoming JSON payloads and telemetry streams against predefined schemas before they reach analytical storage layers.
Role-Based Access Control (RBAC): Ensure frontline operators, plant supervisors, and external contractors only have access to their designated workstations and sensitive operational records.
Structured UI Validation: When collecting human-entered operational data, replace open-text boxes with dropdown taxonomies, required fields, and photo verification to eliminate unstructured logging errors.
Audit Readiness and Compliance: Maintain immutable historical event logs to support compliance tracking, safety audits, and maintenance verifications.
Frequently Asked Questions About Real-Time Data Platforms
What is the latency difference between true real-time and near-real-time data?
True real-time systems process, evaluate, and return query results in sub-second timeframes (ranging from microseconds to low milliseconds), which is critical for algorithmic trading, telematics, and automated safety systems. Near-real-time systems operate on brief micro-batch intervals ranging from several seconds to a few minutes. For operational and lean manufacturing workflows, near-real-time data freshness is more than fast enough to catch production bottlenecks and resolve equipment stoppages before they impact overall shift output.
How do modern streaming engines unify live streaming and historical data analysis?
Modern analytical engines use hybrid storage designs. Streaming components ingest events directly into memory or local write-caches for immediate querying. Concurrently, an asynchronous background process flushes and compresses incoming batches into columnar files (such as Apache Parquet) stored on durable object storage. A unified SQL query engine accesses both in-memory buffers and cold historical partitions simultaneously, allowing users to query live operational telemetry alongside multi-year historical trends in a single SQL statement.
Why does real-time context matter for operational AI and automation?
Generative AI models and autonomous operational agents cannot make reliable decisions if their reference data is hours or days out of date. Feeding stale data into automated workflows leads to hallucinations, false alarms, and poor recommendations. Supplying live operational context through semantic caching, in-memory feature stores, and real-time vector search ensures AI agents evaluate current machine states, active work orders, and live inventory levels accurately.
What to do next
Connecting operational awareness to fast, structured execution is what separates world-class facilities from operations held back by paper logs, unclosed CI loops, and reactive firefighting.
Modern real time data software empowers your workforce to spot deviations the moment they happen. However, high-speed streaming databases only solve part of the equation. To build a truly responsive, lean manufacturing operation, your plant floor needs a reliable system that bridges the gap between raw data and human action.
Thrive provides that missing link. Built specifically for small to midsize manufacturers, Thrive digitizes lean work processes in real time without replacing your core ERP or MES systems. As a flexible digital toolbox for logging issues, tracking actions, and driving continuous improvement, Thrive helps teams establish structured, accountable habits across operations, maintenance, quality, and safety. By ensuring data is entered accurately at the source via mobile, tablet, or desktop, your entire organization gains the visibility needed to eliminate waste, boost productivity, and improve operational profitability.
Take control of your operational data: explore our continuous improvement software to see how structured digital workflows transform plant floor performance.