
The Most Effective Solution for OEE Calculation and Improvement
Understanding OEE Overall Equipment Efficiency and Core Principles
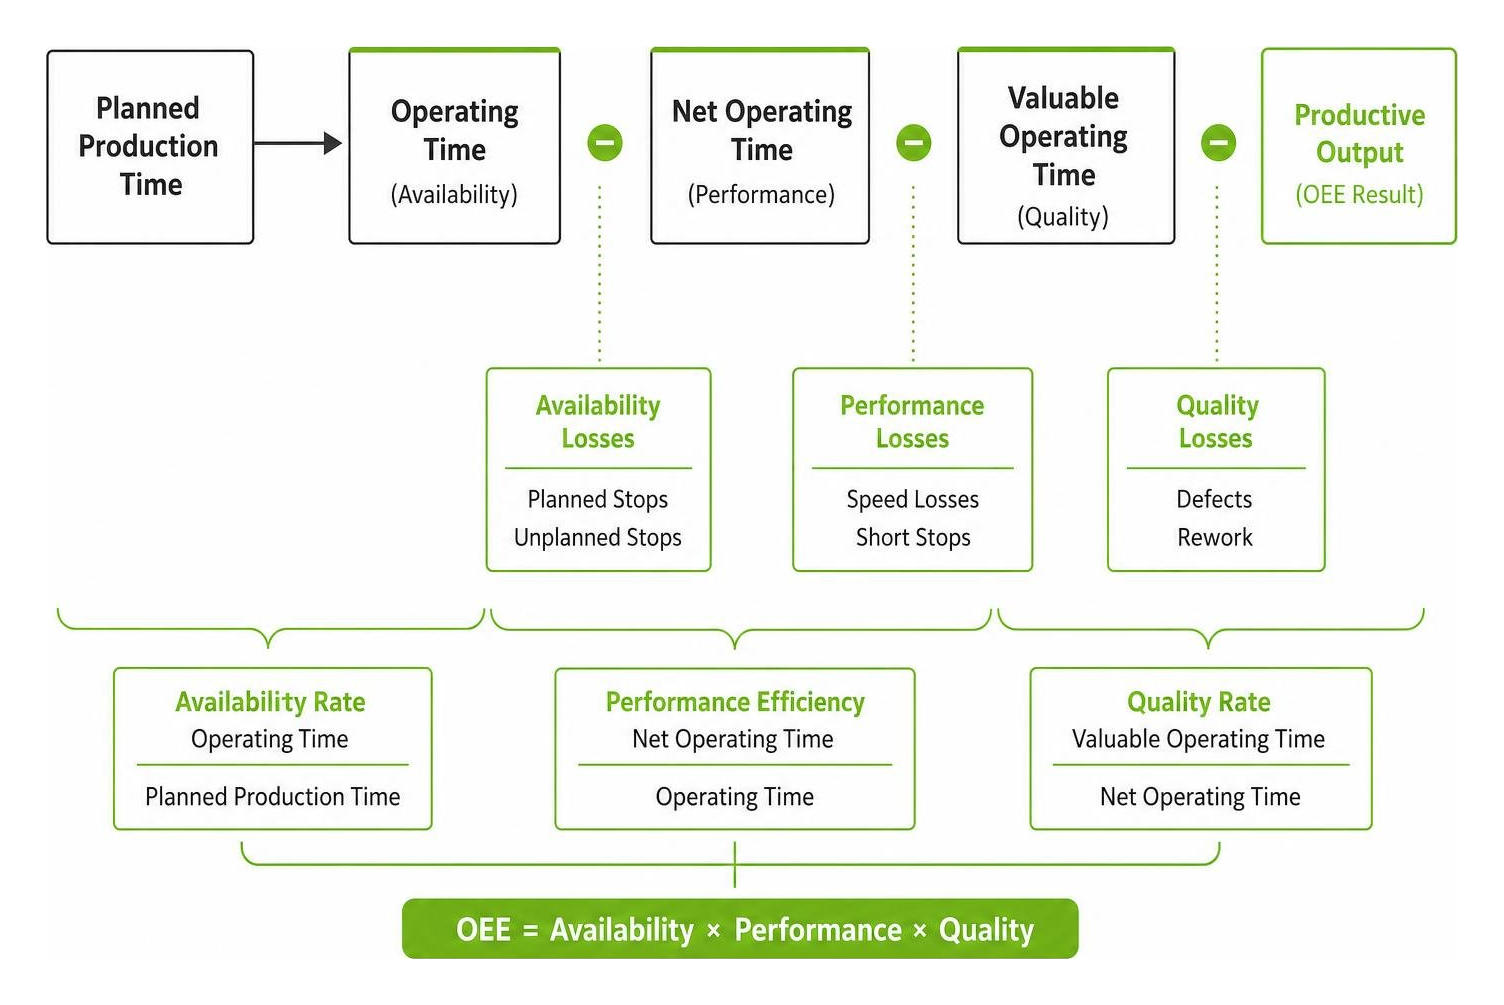
Tracking oee overall equipment efficiency eliminates the guesswork behind missed shift targets and persistent shop floor bottlenecks. OEE is calculated by multiplying Availability, Performance, and Quality ($\text{OEE} = \text{Availability} \times \text{Performance} \times \text{Quality}$), measuring the exact percentage of planned production time that yields good parts at full speed. Improving this score requires capturing standardized downtime reasons at the source, targeting the "Six Big Losses," and implementing structured maintenance and continuous improvement workflows.
Breaking Down OEE Overall Equipment Efficiency: Availability, Performance, and Quality
First formulated by Seiichi Nakajima in 1982 within the framework of Total Productive Maintenance (TPM), OEE breaks machine productivity into three measurable factors: Availability, Performance, and Quality. For a comprehensive background on these standards, see this Introduction to Overall Equipment Effectiveness.
Availability Rate: Measures the proportion of planned production time that equipment actually runs. It accounts for planned and unplanned stops, excluding non-scheduled plant closures.
Performance Efficiency: Evaluates production speed against the theoretical maximum or ideal cycle time. It highlights slowdowns and short halts.
Quality Rate: Quantifies the percentage of manufactured units that meet standard specifications on the first pass, isolating scrap and rework losses.
When multiplied together, these three factors reveal the actual percentage of planned time that was truly productive. Understanding how these elements interact is fundamental to maximizing overall manufacturing efficiency.
The Six Big Losses and the Manufacturing Loss Cascade
The core purpose of OEE is to categorize and expose the "Six Big Losses" that consume capacity across factory lines:
Equipment Breakdowns (Availability Loss): Unplanned downtime caused by mechanical, electrical, or tooling failures.
Setup and Adjustments (Availability Loss): Changeovers, material adjustments, warm-up periods, and tooling swaps.
Minor Stops (Performance Loss): Intermittent pauses lasting under a few minutes due to sensor misalignments, product jams, or brief cleaning cycles.
Reduced Speed (Performance Loss): Operating machinery below its design speed because of operator caution, equipment wear, or substandard raw materials.
Process Defects (Quality Loss): Scrapped or rejected parts manufactured during steady-state production.
Reduced Yield (Quality Loss): Off-spec parts produced during equipment start-up, product changeovers, or temperature ramp-ups.
Systematically categorizing these losses enables practical manufacturing waste reduction by pinpointing root causes instead of treating general symptoms.
OEE vs TEEP vs OOE: Defining Operational Scope
Manufacturers frequently mix up OEE with related metrics such as Total Effective Equipment Performance (TEEP) and Overall Operations Effectiveness (OOE). Each metric serves a distinct purpose depending on how time is accounted for:
Metric | Time Horizon Evaluated | Denominator Used | Primary Application |
|---|---|---|---|
OEE | Planned Production Time | Operating Schedule (excluding planned breaks/closures) | Measures shop floor equipment utilization and operational efficiency |
OOE | Total Planned Operations Time | Total Operating Time (including unscheduled shift gaps) | Evaluates operational planning and scheduling effectiveness |
TEEP | Total Calendar Time (24/7/365) | All Available Calendar Hours (168 hours/week) | Identifies hidden capacity and informs equipment investment decisions |
TEEP multiplies OEE by a loading rate (Planned Production Time divided by Total Calendar Time). Using an integrated capacity planning tool alongside these metrics helps planners determine whether demand can be met by opening unworked shifts rather than purchasing new equipment.
Step-by-Step OEE Calculation and Real-World Examples
Mathematical Formulas and Component Multipliers
Calculating OEE follows a logical progression from available operating hours down to fully productive output:
Availability = Run Time / Planned Production Time (where Run Time = Planned Production Time − Stop Time)
Performance = (Ideal Cycle Time × Total Count) / Run Time (or Total Count / [Run Time × Target Run Rate])
Quality = Good Count / Total Count (where Good Count = Total Count − Reject Count)
$$\text{OEE} = \text{Availability} \times \text{Performance} \times \text{Quality}$$
Real-World Shift Calculation Example
Consider an 8-hour shift (480 minutes) with the following parameters:
Planned Breaks: 30 minutes (Planned Production Time = 450 minutes)
Unplanned Stops: 60 minutes of maintenance downtime (Run Time = 390 minutes)
Ideal Run Rate: 1 part per minute (0.0167 hours per part)
Total Parts Produced: 360 units
Rejected Defective Parts: 31 units (Good Count = 329 units)
Let's compute the components:
Availability: $390 / 450 = 86.67\%$
Performance: $(360 \text{ parts} \times 1 \text{ min/part}) / 390 \text{ minutes} = 92.31\%$
Quality: $329 / 360 = 91.39\%$
$$\text{OEE} = 0.8667 \times 0.9231 \times 0.9139 = 73.12\%$$
Notice how mathematical compounding pulls the overall score down to roughly 73%, even though each individual rate appears relatively healthy above 86%. Visualizing these calculations using a dedicated manufacturing analytics platform clarifies how small losses in each category accumulate into lost capacity.
Batch vs Continuous Process Industry Standards
Standard baselines and targets vary significantly across manufacturing environments. Historical data published in academic and industrial literature, such as standard guides on Overall equipment effectiveness, outlines these typical performance bands:
Batch Manufacturing (e.g., machining, assembly, packaging):
Initial Baseline: Typically starts between 40% and 70%.
World-Class Standard: Broadly recognized at 85% or higher (e.g., >90% Availability, >95% Performance, >99% Quality).
Continuous Process Industries (e.g., chemical refining, paper mills):
Initial Baseline: Frequently ranges from 50% to 80%.
World-Class Standard: Often targets 90% to 95% due to continuous, uninterrupted processing runs.
Frameworks such as ISO 22400-2 and VDI 3423 offer formal engineering structures to standardize how these states and KPIs are calculated across diverse equipment types.
Data Collection Strategies and Implementation Pitfalls
Automated vs Manual Data Capture on the Shop Floor
Data integrity directly dictates the value of OEE tracking. Without reliable data collection, teams often spend more time debating the accuracy of reports than resolving shop floor issues.
Manual Log Sheets:
Pros: Inexpensive and easy to implement immediately.
Cons: Susceptible to human error, missed entries, and late shift-end approximations. Operators often omit micro-stops under 5 minutes.
Integrated Digital Data Capture:
Pros: Ensures standardized downtime reason codes, immediate timestamping, and reliable shift records.
Cons: Requires consistent operator logging habits or direct integrations with shop floor data interfaces.
Pairing automated state tracking with human context gives you the best results. Establishing a standardized downtime threshold—such as requiring an explicit downtime reason code for any stop exceeding 2 minutes—maintains operational discipline while supporting real-time production monitoring on critical lines.
OEE Overall Equipment Efficiency Myths: The 85% Benchmark and Misconceptions
Several persistent myths can undermine an OEE implementation:
The "85% is Mandatory World-Class" Myth: An 85% score is not an absolute rule. In high-mix, low-volume environments with frequent product changes, a 70% OEE may represent exceptional operational performance. Conversely, a continuous bottling line running at 85% may be underperforming.
Machine-to-Machine Comparison Errors: Comparing OEE directly across different machine types or production lines is misleading. Two machines can post identical 75% OEE figures while having entirely different failure profiles—one losing hours to changeovers, the other suffering from chronic scrap.
Using OEE for Employee Evaluation: Nakajima designed OEE to measure equipment productivity and systemic operating losses, not operator effort. Tying individual operator appraisals to OEE figures incentivizes bad data logging, unrecorded speed reductions, and delayed quality reporting.
Efficiency vs. Profitability Trade-Offs: Pushing for maximum OEE without considering demand can lead to overproduction and excess inventory. Focus on solving bottlenecks with better insights at key constraints rather than running non-bottleneck machines at maximum speed just to improve a score.
Practical Framework for Improving OEE on the Shop Floor
Total Productive Maintenance (TPM) and Asset Reliability
Sustained OEE improvements require structured maintenance practices that eliminate equipment failure causes before breakdowns happen.

Autonomous Maintenance: Train and empower operators to handle routine cleaning, visual inspections, lubrication, and minor tightening. This proactive care prevents small physical issues from turning into major breakdowns.
Structured Preventive Routines: Transition away from reactive troubleshooting by deploying reliable preventive maintenance in manufacturing.
Planned Maintenance Integration: Align maintenance schedules with production planning using planned maintenance TPM principles to ensure scheduled stops occur with minimal disruption to delivery commitments.
Lean Continuous Improvement and Root Cause Elimination
Once OEE data reveals where the largest losses occur, continuous improvement teams can apply targeted Lean methodologies to resolve them:
Single-Minute Exchange of Die (SMED): Streamline changeover workflows by moving internal setup steps (completed while the machine is stopped) to external setup steps (prepared while the machine is still running).
5 Whys and Fishbone Root Cause Analysis: Apply structured continuous improvement tools in manufacturing to investigate chronic stops and quality defects rather than repeatedly clearing symptoms.
Closed-Loop Corrective Actions: Track every high-impact downtime event through formal corrective action management to verify that physical adjustments or standard operating procedure (SOP) updates permanently resolve the failure mode.
Frequently Asked Questions About OEE Overall Equipment Efficiency
What is the difference between overall equipment efficiency and overall equipment effectiveness?
While used interchangeably in casual conversation, "effectiveness" is the formal industry standard term established in Nakajima's TPM framework. Effectiveness measures the actual productive output achieved relative to a machine's full potential during planned time, whereas efficiency typically refers to output achieved relative to input resources (energy, labor, raw materials).
What is considered a good OEE score for a discrete manufacturing facility?
Many discrete facilities begin tracking with baseline scores between 40% and 60%. An OEE score of 60% to 75% indicates standard performance with identifiable opportunities for improvement. Scores above 80% indicate mature operations, while 85% is widely regarded as world-class for discrete assembly.
How do minor stops differ from equipment breakdowns in OEE calculations?
Equipment breakdowns are availability losses where a machine stops for an extended period, usually requiring maintenance support. Minor stops are performance losses lasting from a few seconds to a couple of minutes, which operators typically resolve without maintenance intervention.
In Summary
Measuring and improving oee overall equipment efficiency provides manufacturing operations with a practical way to systematically uncover hidden production losses, align cross-functional teams, and protect plant profitability. When teams work with clean data and structured continuous improvement methods, small percentage-point gains turn into substantial capacity and margin improvements.
Thrive offers the fastest path to structured, accountable work processes by giving operations, maintenance, and quality teams a single, cohesive workspace. Built specifically for small to midsize manufacturers, Thrive provides a digital platform to digitize lean work processes in real time without replacing ERPs or MES systems. Teams gain real-time visibility when daily processes are structured and data is entered directly at the source via mobile, tablet, or desktop. Functioning as a flexible digital toolbox for logging issues, tracking actions, and driving continuous improvement, Thrive organizes action from machine data entered by teams or imported from other systems. Explore our comprehensive Guide to Digital Lean Manufacturing to learn how to structure your daily operations for sustainable, long-term operational success.