The Ultimate Guide to Manufacturing Waste Management Solutions
Physical Streams and Environmental Impacts of Manufacturing Waste
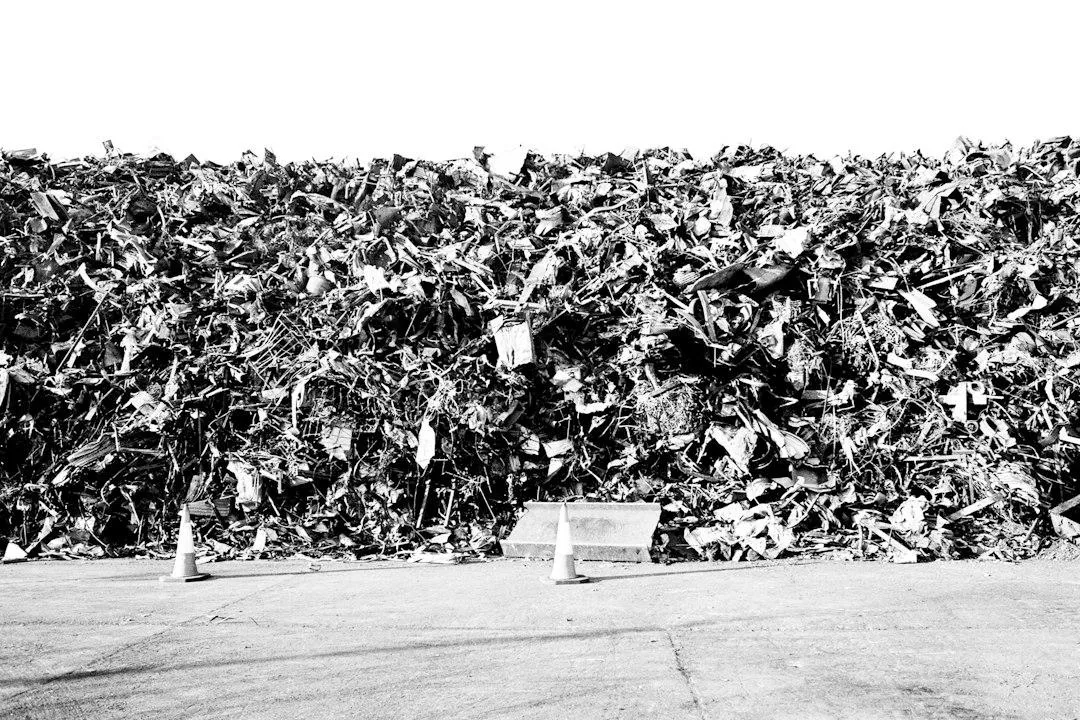
Effective manufacturing waste management solutions combine source reduction, segregation, and closed-loop recovery to keep materials out of landfills and protect plant margins. Physical waste on the shop floor takes many forms, from aluminum turnings under a CNC mill to drums of spent solvent beside a paint booth. According to industry statistics on industrial scrap, global manufacturing and industrial activities produce approximately 7.6 billion tons of industrial waste each year—roughly 25 times the volume of municipal solid waste.
When materials leave the production cycle as scrap, they carry away the embedded energy, labor, and capital invested in processing them. Globally, 37% of all waste is kept in landfills, while only 8% enters modern sanitary landfills with advanced emission controls. Solid waste treatment and disposal accounted for 1.6 billion tons of CO2 equivalent greenhouse gas emissions in recent benchmarks, representing roughly 5% of global emissions. With global waste production projected to reach 3.40 billion tons by 2050, plants that control their physical scrap protect both their operational margins and their local environments.
Classifying Solid, Liquid, Chemical, and Organic Residues
Controlling plant residuals requires categorizing materials based on handling rules, safety hazards, and recovery value:
Solid Scrap and Offcuts: Includes metal turnings, plastic runners, stamping skeletons, cardboard packaging, and wooden pallets. These materials occupy valuable floor space but retain high commodity value when kept clean and unmixed.
Chemical Waste and Spent Solvents: Degreasers, parts-washer baths, thinners, and chemical cleaning residues. These materials create significant workplace safety risks and strict disposal requirements.
Liquid Effluent and Process Sludge: Cutting fluid emulsions, phosphating rinses, painting sludge, and washdown water requiring specialized on-site treatment or haulage.
Electronic Waste (E-Waste): Discarded circuit boards, damaged programmable logic controllers (PLCs), sensors, and cabling containing heavy metals and rare earth elements.
Organic and Biological Refuse: Common in food and beverage processing, where residues degrade rapidly and create biological oxygen demand (BOD) spikes in municipal sewers. In food manufacturing alone, 13.1 million tons of surplus food was generated in 2024, with dairy and eggs making up 44.7%, produce 23.1%, and dry goods 18.4%. Production line waste and byproducts caused 90.1% of this total.
Unchecked material loss often conceals hidden waste within secondary processes, such as excess protective packaging, over-applied coatings, and discarded trim that never gets logged in standard inventory counts.
Ecological and Financial Costs of Industrial Effluent
Improperly managed industrial effluent and airborne emissions create substantial ecological liabilities, from volatile organic compound (VOC) releases to groundwater contamination. Beyond ecological damage, the direct financial burden on plants is growing. In high-income countries, operational waste management and haulage costs frequently exceed $100 per ton.
A Science Publishing Group study on zero-waste strategies highlights that high-income nations produce more than 34% of global waste despite representing only 16% of the population. When plants discharge untreated effluent or generate unsegregated hazardous sludge, they face compounding tipping fees, surcharge penalties from municipal wastewater utilities, and potential regulatory fines. Treating waste streams as unmanaged overhead directly erodes plant profitability.
Regulatory Compliance and Sector-Specific Handling Practices
Environmental compliance begins with the Resource Conservation and Recovery Act (RCRA) in the United States, which establishes "cradle-to-grave" liability for hazardous substances. Manufacturers remain legally responsible for their waste from the point of generation, through transit, to final treatment or disposal. Reviewing EPA guidance on sector waste profiles helps environmental health and safety (EHS) officers identify typical exposure points across diverse sectors:
Fabricated Metal & Machining: Generates spent cutting fluids, degreasing baths (D001, F001), and heavy-metal grinding dust.
Industrial Painting & Coating: Produces solvent-laden paint sludges, spent thinners (F005), and excess curing agents.
Chemical & Plastics Processing: Generates reactive distillation bottoms, acidic or alkaline cleaning rinses, and off-spec polymers.
Vehicle & Equipment Maintenance: Accumulates used motor oils, lead-acid batteries, contaminated shop rags, and universal waste lamps.
Regulatory Frameworks and Handling Hazardous Manufacturing Waste
Under RCRA guidelines, solid wastes are classified as hazardous either by inclusion on specific EPA lists (F, K, P, and U lists) or through four distinct characteristics:
Ignitability (Code D001): Liquids with a flashpoint below 140°F (60°C) or non-liquids capable of causing fire through friction or absorption of moisture.
Corrosivity (Code D002): Aqueous wastes with a pH less than or equal to 2.0 or greater than or equal to 12.5.
Reactivity (Code D003): Unstable materials that react violently with water, form toxic gases, or detonate under normal conditions.
Toxicity (Codes D004–D043): Wastes that leach specific toxic contaminants (such as lead, cadmium, or benzene) above regulatory thresholds during Toxicity Characteristic Leaching Procedure (TCLP) testing.
Facilities are classified into three generator tiers based on monthly volume: Very Small Quantity Generators (VSQGs generating under 100 kg/month), Small Quantity Generators (SQGs generating 100 to 1,000 kg/month), and Large Quantity Generators (LQGs generating over 1,000 kg/month). Each tier dictates strict accumulation time limits, secondary containment standards, inspection routines, and training requirements.
Best Practices for Solvents, Oils, and Heavy Metals
Proper segregation prevents non-hazardous materials from becoming cross-contaminated. Mixing a single cup of chlorinated solvent into a 55-gallon drum of used oil turns the entire drum into regulated hazardous waste, dramatically increasing haulage and disposal costs.

Facilities can reduce exposure and improve recovery by implementing dedicated reclamation loops:
Solvent Distillation: Installing on-site batch vacuum distillation units allows plants to recover up to 80-90% of spent cleaning solvents (such as acetone, xylene, and isopropyl alcohol) for reuse in wash stations.
Used Oil Management: Keeping hydraulic and lubricating oils segregated from coolants and solvents enables re-refining or high-efficiency closed-loop fuel blending.
Heavy Metal Recovery: Neutralizing metal finishing rinses through precipitation and filtration recovers valuable raw resources. Advanced technologies, including MIT News research on aluminum filtration using specialized charged nanofiltration membranes, demonstrate that over 99% of metal ions can be captured directly from industrial waste streams for re-smelting.
Silver and Heavy Metal Precipitation: Photo processing and non-destructive testing labs capture silver from fixing solutions using electrolytic recovery cells or chemical replacement cartridges before discharging treated water.
Lean Methodologies and Operational Efficiency Strategies
Lean manufacturing focuses on systematically stripping away non-value-added activities that consume labor, energy, and materials without improving the end product. Plant managers achieve lasting gains by conducting a detailed value separation analysis across each production cell to distinguish value-adding steps from operational waste.
Identifying the 8 Types of Lean Manufacturing Waste
The TIMWOODS framework defines eight primary operational wastes that directly drive physical scrap and process losses:
Transport: Unnecessary movement of raw materials or work-in-process (WIP) between bays, increasing the risk of transit damage and part rejection.
Inventory: Excess raw stock or finished goods tying up working capital and risking shelf-life expiration or physical degradation.
Motion: Operators bending, reaching, or searching for tools due to poorly configured workstations, causing fatigue and assembly errors.
Waiting: Production lines idling due to material shortages, late changeovers, or slow approvals.
Overproduction: Making products ahead of demand, which creates excess storage costs, forces obsolete scrap, and masks line defects.
Over-processing: Using higher precision tooling, excess paint coats, or unnecessary packaging beyond customer specifications.
Defects: Off-spec parts requiring rework, destructive testing, or outright disposal. Implementing practical lean methods for eliminating waste directly targets these defect roots.
Skills (Unused Talent): Failing to engage machine operators and maintenance technicians in problem-solving and process improvements.
Operational inefficiencies often stem from poor communication and waste in information flow, such as delayed shift handovers, misplaced paper setup sheets, and disconnected spreadsheets that leave operators working with outdated instructions.
Workplace Organization and 5S Standardization
Workplace organization forms the foundation of any structured lean production system. The 5S methodology creates a clean, predictable workspace where abnormalities become instantly visible:
Sort (Seiri): Red-tag and clear out broken jigs, surplus tooling, obsolete raw stock, and unneeded containers from the work area.
Set in Order (Seiton): Arrange essential tools, hoses, gauges, and material carts in logical, labeled locations using shadow boards and floor striping.
Shine (Seiso): Clean equipment, inspect for hydraulic leaks, remove swarf, and maintain clean operating environments to catch mechanical issues early.
Standardize (Seiketsu): Create visual work instructions, color-coded scrap bins, and clear cleaning checklists across all shifts.
Sustain (Shitsuke): Run structured weekly audits and review operational scores during daily tier meetings.
Integrating 5S routines with Lean Six Sigma methodologies ensures frontline teams have the tools, visibility, and accountability needed to catch process drift before it causes mass scrap events.
Developing a Site-Wide Waste Management and Prevention Program
Transitioning from reactive scrap disposal to proactive waste prevention requires structural process adjustments. The table below outlines how traditional disposal methods compare with systematic pollution prevention (P2) strategies:
Waste Stream | Traditional Handling Method | Pollution Prevention (P2) Solution | Operational Impact |
|---|---|---|---|
Machining Coolant | Run until rancid; pump out and pay haulage fees | Tramp oil skimming, aeration, and fine filtration | Extends fluid life by 300%; cuts fluid replacement costs |
Parts Degreasing | Mineral spirits or chlorinated solvent dip tanks | Aqueous ultrasonic wash systems or bio-remediation | Eliminates VOC emissions and hazardous waste codes |
Product Finishing | Conventional air spray guns (30-40% transfer) | High-Volume Low-Pressure (HVLP) or electrostatic spray (65-85% transfer) | Cuts paint consumption and booth filter sludge by up to 50% |
Metal Offcuts | Collect mixed scrap in single yard dumpster | Segregate alloys at machine source into color-coded hoppers | Boosts scrap resale value by 20-40% per ton |
Process Washwater | Direct discharge to sewer with pH adjustments | Closed-loop membrane filtration and rinse re-circulation | Cuts municipal water use and eliminates surcharge fees |
Establishing clear operational standards aligns with recognized SME waste management best practices. Applying the data-driven framework outlined in MDPI research on eco-efficiency assessment helps operations teams balance the direct economic costs of material consumption against its broader lifecycle footprint.
Conducting Baseline Waste Audits and Material Flow Mapping
You cannot manage what you do not measure. A comprehensive baseline audit maps every material input against final product yield and residual outputs:
Map Mass Balances: Compare incoming raw material tonnage against finished product shipping weights to pinpoint loss points.
Characterize Point Generation: Track exactly which production line, work center, shift, or tool profile generates specific scrap streams.
Conduct Multi-Layer Stream Mapping: Track cycle times, energy draw, and consumable usage alongside physical material flows.
Identify Root Causes: Use 5-Why analysis during continuous improvement lean management reviews to find out why off-spec scrap occurred rather than merely logging the scrap quantity.
Pollution Prevention and Closed-Loop Recycling Systems
Source reduction keeps unnecessary materials from entering the plant entirely. Adopting circular production models as detailed in Springer study on circular economy models helps plants turn low-value waste streams into reusable raw materials:
Material Substitution: Replace hazardous solvent cleaners with neutral-pH aqueous solutions or automated citric acid passivation systems.
High-Transfer Application: Upgrade painting and coating lines to electrostatic or robotic spray systems to eliminate overspray sludge.
In-House Regrind: Granulate clean thermoplastic sprues, runners, and edge trimmings on-line, feeding a controlled percentage directly back into the virgin resin hopper.
Byproduct Upcycling and Industrial Symbiosis: Partner with regional industrial neighbors to transfer one plant's solid residues (such as foundry sand, slag, or organic press cake) as feedstock for cement, aggregate, or agricultural applications.
Shop Floor Data Tracking and Key Performance Indicators
Managing physical and operational waste requires transparent metrics tracked directly at the work center. Common key performance indicators include:
Scrap Rate Percentage: Total scrap material weight divided by total raw material input weight per production run.
Waste Diversion Rate: Percentage of total generated waste diverted away from landfills through reuse, reclamation, composting, or recycling.
Waste Cost per Finished Unit: Combined cost of raw material loss, rework labor, and disposal fees allocated to each salable unit.
Corrective Action Closure Time: Average hours or days taken to resolve root-cause tickets logged on the production line.
Deploying a modern digital lean manufacturing framework replaces slow, vulnerable paper logs with mobile data entry. Operators log defects, scrap weights, and equipment leaks on tablets at the machine source. Supervisors and continuous improvement managers gain immediate visibility into emerging trends across shifts. For an end-to-end overview of lean shop floor systems, consult our complete guide to lean manufacturing solutions.
Frequently Asked Questions about Industrial Scrap and Disposal
What is the most common hazardous waste code generated in industrial plants?
The EPA hazardous waste code D001 for ignitability is among the most common industrial waste codes. It covers spent cleaning thinners, alcohol washes, petroleum distillates, solvent-based paints, and chemical residues with a flashpoint below 140°F (60°C). Facilities generating D001 waste must maintain grounded storage drums, spark-proof ventilation, secondary containment pallets, and strict accumulation time limits based on their generator tier.
How do lean manufacturing methods reduce physical scrap on the line?
Lean tools target the operational root causes of defects. Implementing standardized work ensures operators follow consistent machine setup routines. Visual controls and shadow boards keep incorrect tooling from damaging parts. Pull production via Kanban prevents batch overproduction, ensuring that a machine setup error only affects a small batch rather than an entire warehouse run.
What is the difference between RCRA characteristic codes and listed U-codes?
RCRA characteristic codes (D-codes like D001, D002, D003, and D008) apply to any waste stream that displays ignitable, corrosive, reactive, or toxic properties during testing, regardless of its original source. Listed U-codes (such as U002 for pure acetone) apply specifically to unused, discarded commercial chemical products, off-spec batches, and container residues containing pure or technical-grade toxic chemicals.
In Summary: Achieving Sustainable Shop Floor Performance
Eliminating scrap and streamlining compliance requires daily operational control on the shop floor. When operators lack a simple way to log off-spec parts, machine jams, or chemical leaks at the source, minor setup errors turn into dumpster loads of scrap before supervisors notice the pattern.
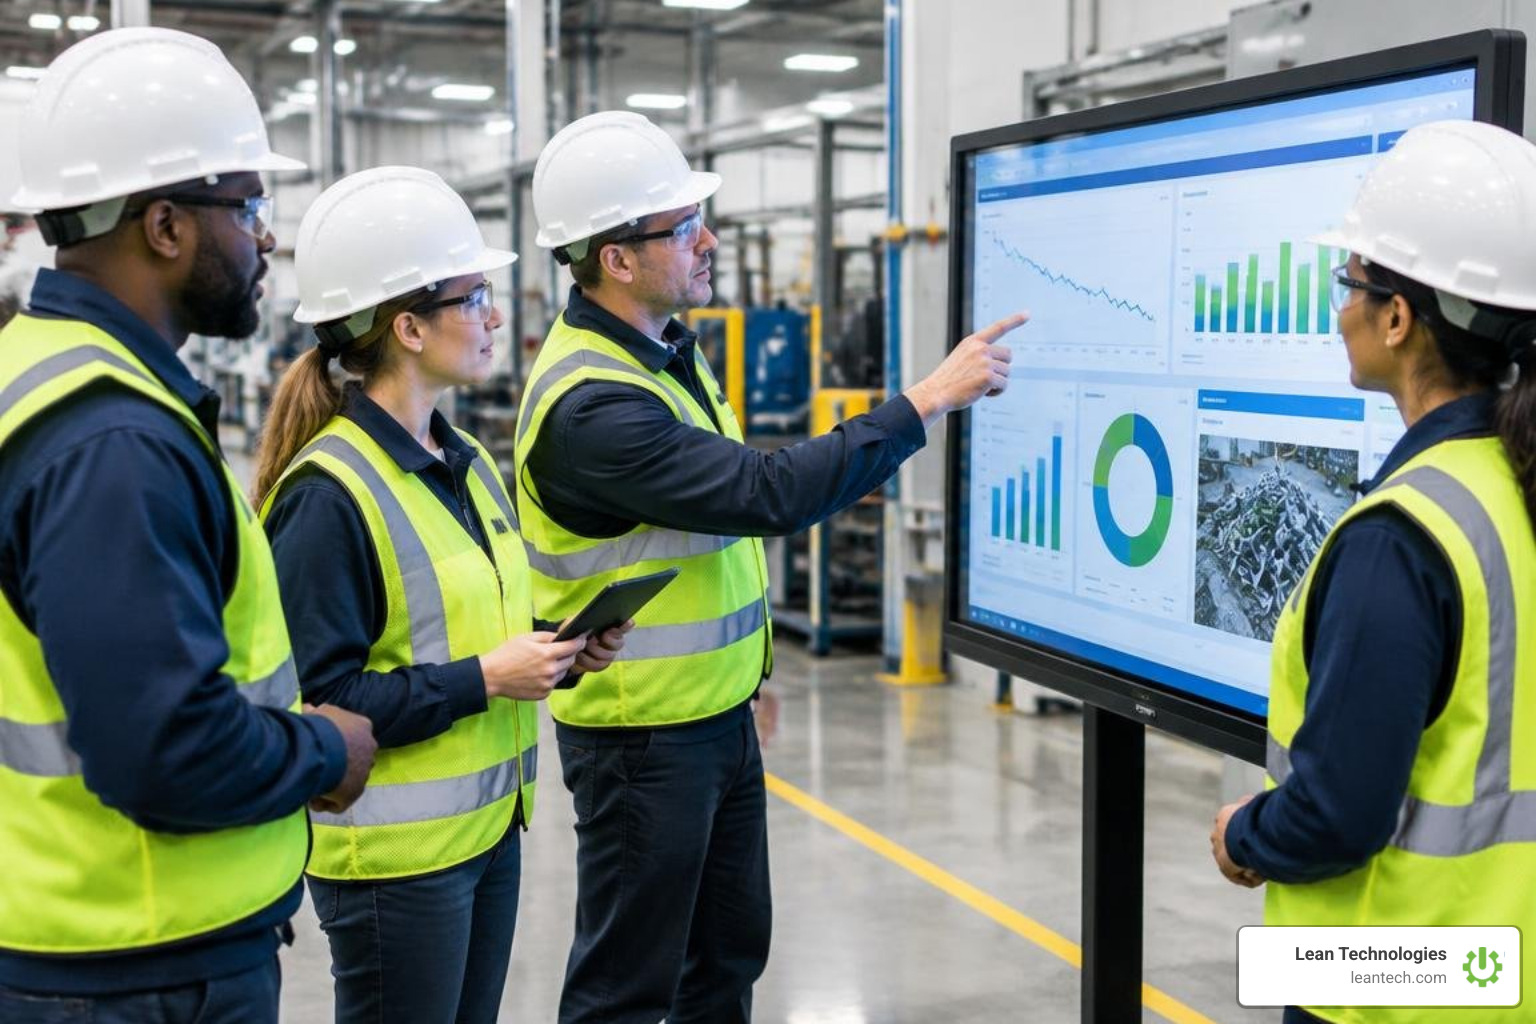
Lean Technologies' Thrive provides a flexible digital toolbox built specifically for small to midsize manufacturers. Thrive gives operators, maintenance technicians, safety coordinators, and CI managers a simple mobile platform to log quality defects, track 5S audits, assign corrective maintenance work orders, and monitor continuous improvement projects in real time.
Thrive does not replace your ERP or MES, nor does it run automated machine sensor algorithms. Instead, it digitizes everyday lean routines, organizing operator-entered data and imported machine inputs so supervisors and plant leaders can spot recurring waste drivers instantly.
Explore how our platform supports proven manufacturing waste reduction strategies, helps teams eliminate repetitive paper workarounds, and builds a culture of continuous improvement across every shift.