

Smart Preventive Maintenance Cost Control Strategies for Plant Supervisors
The Financial Impact of Neglecting Maintenance vs Proactive Investment
Mastering cost control in preventive maintenance requires a disciplined approach to maintenance budgeting, eliminating reactive drift, and reducing budget variance. When plant supervisors balance planned upkeep against the true asset lifecycle cost, facilities escape the trap of spiraling emergency repairs and build a reliable, cost-efficient production floor.
Neglecting regular servicing creates mounting deferred maintenance liabilities. When small adjustments are ignored, an equipment failure cascade inevitably follows. Emergency repairs cost 3 to 5 times more than planned tasks due to overtime premiums, rush shipping, and collateral damage.
Neglected machinery also drives energy efficiency losses. For example, unmaintained HVAC and motor systems waste 10% to 15% more power due to friction and airflow restrictions. Rigorous research on corrective and preventive maintenance economics shows that fixed-interval preventive care provides structural economic stability, slashing total maintenance expenses while dampening budget volatility. Understanding the cost of downtime how to keep production running smoothly helps teams view maintenance as a value-generating investment rather than a drain on capital.
Strategy | Direct Maintenance Cost (% of RAV) | Unplanned Downtime Reduction | MTBF Impact | MTTR Impact |
|---|---|---|---|---|
Reactive | 4.0% – 6.0% | Baseline (High outages) | Baseline | Baseline |
Preventive | 2.5% – 4.0% | 30% – 52.7% reduction | +15% improvement | -10% faster |
Predictive | 1.5% – 2.5% | Up to 70% reduction | +20% improvement | -15% faster |
Why Reactive Work Spirals Maintenance Budgets
Reactive maintenance burns cash fast. When an asset snaps during mid-shift operation, operations managers and maintenance supervisors face compounded expenses:
Expedited Shipping Fees: Overnight air freight on replacement components can double or triple base parts prices.
Emergency Contractor Rates: Premium callout rates for external specialists quickly blow past operational budgets.
Technician Overtime: In-house crews accumulate double-time hours trying to restore production lines.
Secondary Component Damage: A seized $80 bearing often ruins an adjacent $4,500 shaft and damages gearbox housings.
Balancing planned maintenance and unplanned maintenance prevents these compounding costs by addressing minor wear before it causes major line stoppages.
Quantifying the Return on Investment for Scheduled Upkeep
A structured maintenance program delivers a 4:1 to 7:1 return on every dollar invested. Academic and industrial studies show that transitioning from reactive repairs to planned maintenance improves Mean Time Between Failures (MTBF) by 15% and cuts Mean Time to Repair (MTTR) by 10%, decreasing total life-cycle costs (LCC) by 8% to 10%.
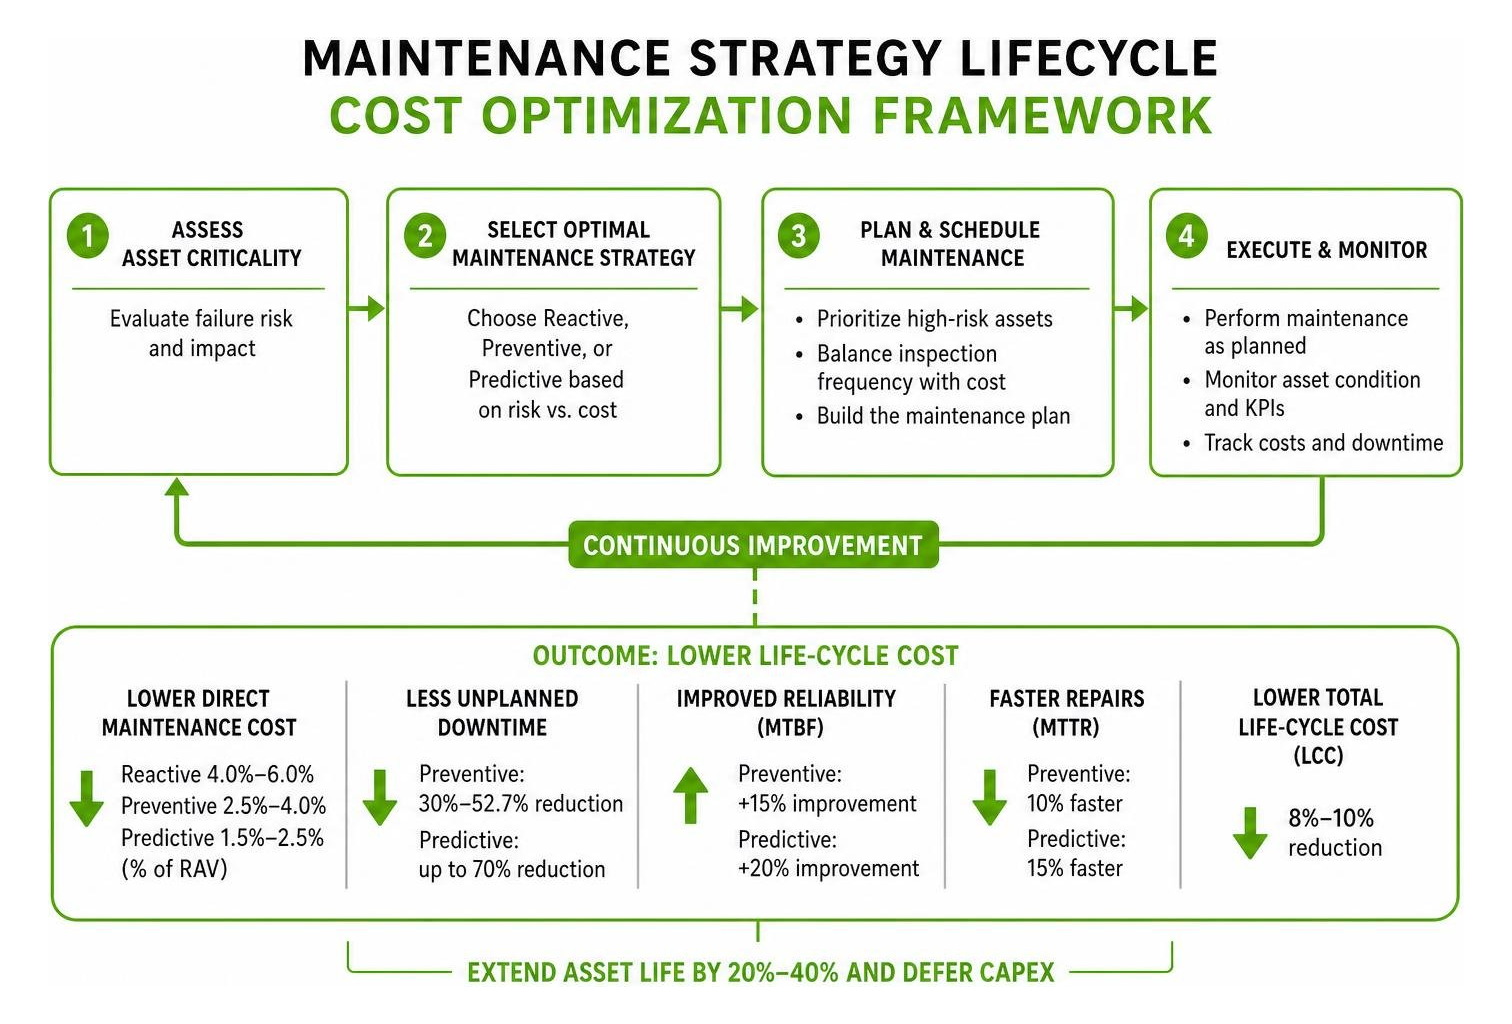
Proactive upkeep extends equipment operating lifespans by 20% to 40%. This lifespan extension allows manufacturers to defer expensive capital expenditures (CapEx) and maximize returns across total asset lifecycle management.
Core Frameworks for Cost Control in Preventive Maintenance
Blindly scheduling recurring tasks across every piece of plant equipment causes maintenance costs to soar. Plant supervisors must implement structured evaluation frameworks to balance preventive expenditures against actual asset failure risks.
Supervisors use asset criticality ranking, failure mode effects analysis (FMEA), breakeven models, and Weibull distribution curves to pinpoint optimal maintenance intervals. A study on maintenance strategy selection and life cycle cost optimization confirms that mapping maintenance tactics to individual component failure profiles saves plant budgets thousands of dollars each year.
Optimizing Maintenance Strategy Selection by Asset Criticality
Not all factory equipment justifies intensive preventive interventions. Categorizing machinery into criticality tiers optimizes budget allocation:
High-Criticality Assets: Bottleneck equipment that triggers whole-plant shutdowns, safety hazards, or regulatory violations. These require precision condition tracking, usage triggers, and comprehensive time-based servicing.
Moderate-Criticality Assets: Redundant or support systems (such as secondary coolant pumps) where failure slows throughput but does not halt the entire plant. These benefit from standardized, calendar- or run-hour-based preventive maintenance.
Low-Criticality Assets: Non-essential, inexpensive items (like isolated exhaust fans) where repair costs are negligible and downtime causes zero operational disruption. These can safely operate within defined run-to-fail boundaries.
Setting these operational boundaries using a preventive maintenance program complete guide stops maintenance teams from burning labor on low-value machinery.
Preventing Over-Maintenance and Eliminating Low-Value Tasks
Over-maintaining machinery can be just as expensive as neglecting it. Unnecessary mechanical disassemblies introduce infant mortality failures, strip bolt threads, and damage delicate seals. Plant supervisors should periodically audit work order logs and prune maintenance schedules.
If an inspection task returns twelve consecutive cycles with zero findings and no corrective actions, extend the interval or replace it with a quick visual check. Pruning low-value tasks frees technician hours and supports broad manufacturing waste reduction goals across the plant.
Overcoming Operational Inefficiencies: Personnel, Legacy Systems, and Human Error
Maintenance labor efficiency directly shapes operating margins. High personnel turnover, missing documentation for legacy machines, and unstandardized work methods waste wrench time and increase operating costs.
A comprehensive study on preventive maintenance planning and human error probability indicates that human errors during maintenance cause 20% to 30% of secondary industrial failures. Accounting for human error through standard work reduces maintenance budgets by up to 15%.

Minimizing Human Error Through Standardized Work Instructions
Standardized operating procedures reduce human error during routine maintenance. Ambiguous paper forms like "Inspect drive unit" lead to inconsistent checks across different shifts.
Supervisors eliminate this variation by rolling out clear digital checklists detailing torque values, lubrication quantities, and safety lockouts. Utilizing dedicated standard work software ensures consistent execution and speeds up onboarding for new technicians.
Maximizing Frontline Technician Efficiency and Resource Allocation
Skilled maintenance technicians should spend their shifts on complex diagnostics, mechanical rebuilds, and reliability projects rather than basic visual checks. Implementing autonomous maintenance practices empowers machine operators to take ownership of simple initial care:
Daily wipe-downs and basic machine cleaning routines
Visual fluid level checks and leak detection
Fast pneumatic pressure checks and filter inspections
Cross-training machine operators preserves skilled technician hours and refines equipment maintenance planning across every shift.
Leveraging Digital Tools for Shop Floor Reliability
Relying on physical paperwork, verbal handoffs, and disconnected spreadsheets obscures maintenance costs and causes PM tasks to slip through the cracks. Frontline teams need modern digital tools to maintain clear visibility over work orders, track repair histories, and capture equipment issues directly at the source.

Modern Technology and Digital Tools for Cost Control in Preventive Maintenance
Operating with a modern maintenance work order system enables plant leaders to eliminate paperwork bottlenecks. Technicians record equipment inspections, order replacement parts, and document root causes directly using mobile devices, tablets, or shop floor terminals.
Adopting a paperless work order system creates verifiable digital audit trails, surfaces hidden cost trends, and ensures tasks get done on schedule without requiring clunky desktop data entry.
Driving Action from Operating Data and Usage Metrics
Calendar-based maintenance often leads to over-maintaining idle machinery or under-servicing heavily loaded production lines. Tying preventive maintenance to actual machine usage metrics—such as operating hours, stroke cycles, or run-time thresholds—keeps service intervals accurate.
Frontline systems drive action from these usage metrics when data is entered directly by the operations team or imported from connected shop floor systems. Tracking machine cycles and runtime alongside real-time production monitoring keeps PM frequencies tightly matched to true machine wear, cutting parts consumption and labor costs.
Step-by-Step Implementation Roadmap for Manufacturing Plants
Transitioning a plant from emergency firefighting to structured cost control requires a clear, step-by-step rollout plan.
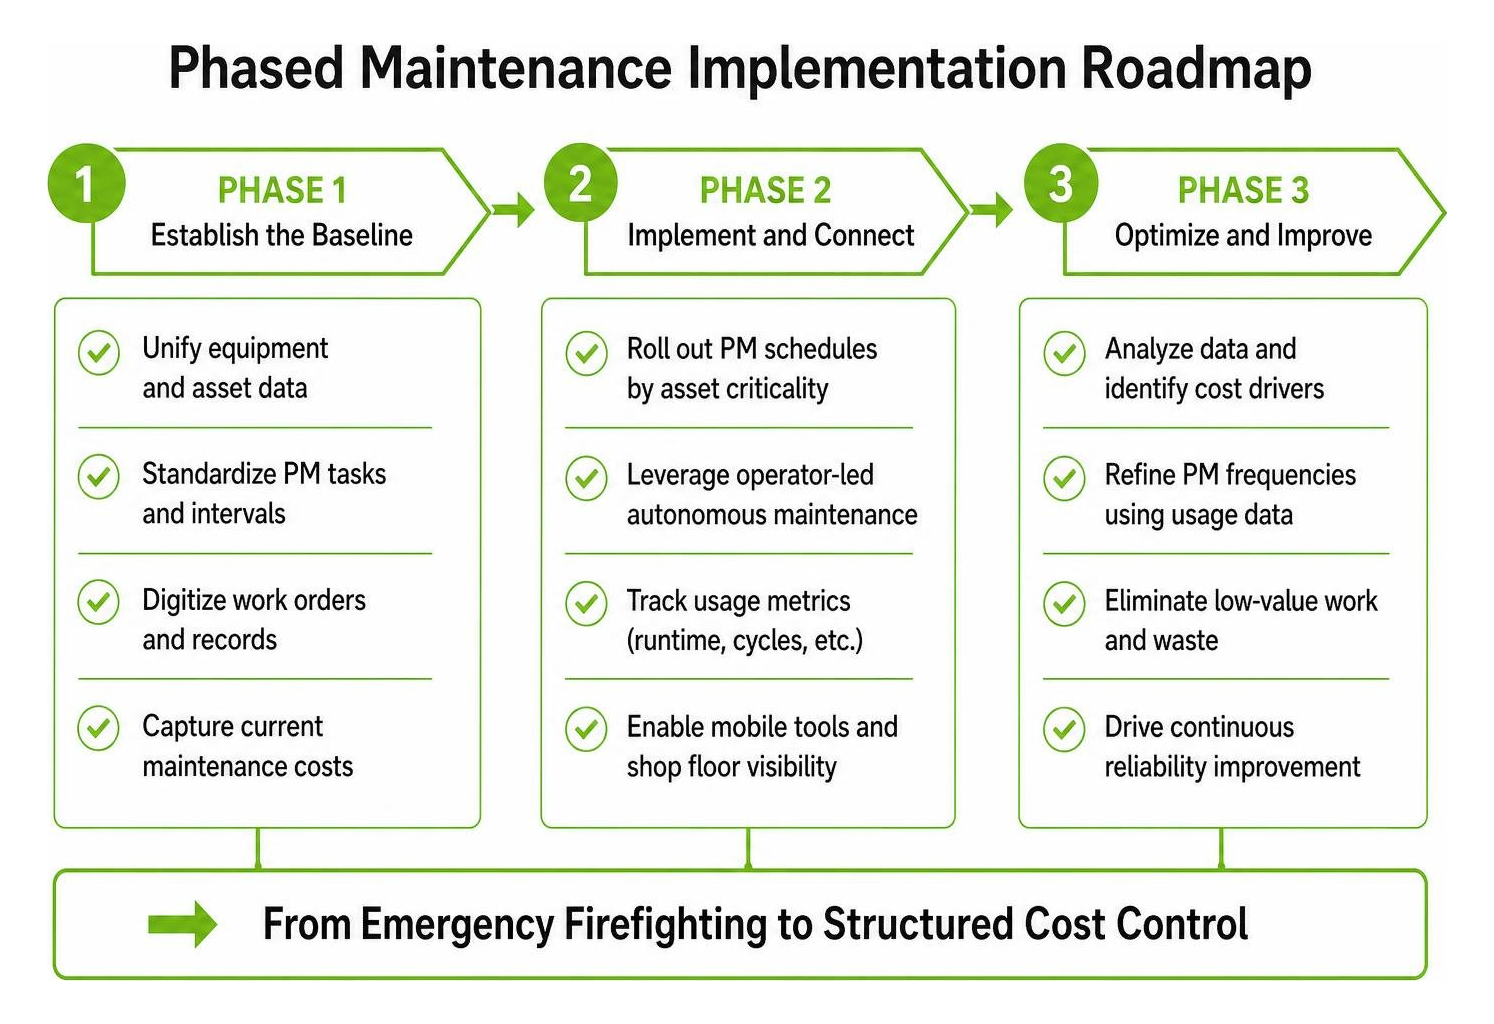
Supervisors can follow our planned preventative maintenance guide 2026 to manage this transition smoothly across three distinct phases.
Phased Rollout Strategies for Cost Control in Preventive Maintenance
Begin Phase 1 by establishing a clean, unified baseline across the facility:
Asset Tagging and Registry: Assign standardized IDs to every asset and subcomponent on the shop floor using equipment asset tracking.
Historical Breakdown Audits: Review the past 12 to 24 months of maintenance logs to identify top breakdown offenders and high-cost equipment.
OEM Guideline Alignment: Cross-reference factory operating manuals with actual operating conditions to establish realistic baseline servicing schedules.
Phase 2: Dynamic Scheduling and Frontline Execution
Once baseline asset profiles are established, move into active execution and schedule optimization:
Deploy standard digital checklists for all routine lubrication, inspection, and cleaning tasks.
Shift high-use equipment from rigid calendar intervals to dynamic runtime hour triggers.
Engage frontline technicians in feedback loops to prune redundant, non-value-adding tasks.
Keep work orders flowing smoothly by learning work order tracking how it reduces downtime and delays.
Phase 3: Continuous Cost Optimization and KPI Tracking
The final phase focuses on continuous improvement and data-driven cost control. Maintenance supervisors, continuous improvement managers, and operations leads should review core operational metrics monthly:
PM Compliance Target: Keep preventive work order completion rates above 85% to 90%.
Emergency Repair Ratio: Maintain emergency and breakdown repair hours below 15% to 20% of total maintenance time.
Maintenance Cost Per Asset: Track parts spend and labor hours against asset replacement value.
OEE Impact: Measure equipment performance and availability gains via oee overall equipment efficiency tracking.
Frequently Asked Questions about Preventive Maintenance Cost Control
What is the ideal planned-to-unplanned maintenance ratio for cost efficiency?
A healthy baseline for cost-effective manufacturing operations is an 80:20 ratio, where 80% of maintenance hours are planned proactive tasks and no more than 20% are unplanned reactive fixes. World-class manufacturing facilities frequently achieve a 90:10 ratio. Ratios dipping below 70:30 indicate severe reactive drift, leading to budget overruns and frequent production interruptions.
How do you calculate the breakeven ratio of a preventive maintenance task?
Calculate task breakeven by dividing the total financial cost of an equipment failure by the full cost of executing the preventive maintenance task:
$$\text{Breakeven Ratio} = \frac{\text{Direct Repair Cost} + \text{Downtime Losses}}{\text{PM Labor Cost} + \text{PM Parts Cost} + \text{Planned Outage Cost}}$$
A ratio greater than 3:1 strongly justifies keeping or expanding the preventive maintenance task. Ratios between 1.5:1 and 3:1 indicate the task should be streamlined or moved to a longer interval. If the ratio falls below 1:1 and carries no safety or regulatory compliance impact, the task should be eliminated.
How long does it take to see measurable cost savings from a PM program?
Most manufacturing plants see early operational wins within 90 days as PM compliance rises and quick-fix emergency calls begin to drop. Measurable reductions in emergency repair spending, technician overtime, and expedited freight charges typically become clear between months 3 and 6. Full lifecycle cost reductions—including lower total maintenance spending, improved MTBF, and extended equipment lifespan—are realized across a 12-to-18-month operating horizon.
What to Do Next
Achieving long-term cost control in preventive maintenance is about balancing maintenance spend against true downtime risk. Plants protect operational margins and maintain steady production by eliminating low-value checks, standardizing procedures, and giving frontline teams easy-to-use digital tools.
Shifting away from paper workarounds and disconnected spreadsheets gives supervisors real-time visibility into shop floor maintenance. Thrive, Lean Technologies' flexible digital toolbox for small to midsize manufacturers, digitizes lean work processes so operators and maintenance teams can log issues, track corrective actions, and drive continuous improvement.
Thrive is not an ERP or MES, and it is not designed to replace your current ERP or MES infrastructure. It does not collect automated sensor data or send predictive machine alerts; instead, Thrive organizes and drives immediate action from machine and process data when logged by your team or imported from other systems.
Explore how structured planned maintenance tools help frontline teams cut downtime, stabilize budgets, and build a safer, more productive plant floor.